

Is Your Value ETF an AI Fund? What VTV, IWD, AVLV and AVUV Hold
On Nov 12, 2026, VLUE had 18.6% in Micron; AVUV held no big AI names. What nine value ETFs own, how they did in the AI selloff, and what their loadings show.
Nvidia’s stock fell more than 30% from early October to mid-November 2026, and its chief executive resigned on November 11. On November 13, Jason Zweig used his Wall Street Journal column to warn investors looking to value funds for shelter from the AI trade.1 His point: a fund with “Value” in its name may not hold the cheap, unexciting companies people expect. Semiconductor makers own large factories, which inflates their book value and qualifies them for value indexes even when they look expensive on other measures, such as price to sales. Many value funds still hold AI-adjacent giants such as Apple and Microsoft.
I agree with the warning. My own reaction, posted on my Engineer Investor account the same morning, was that the AI label does not matter much to me:
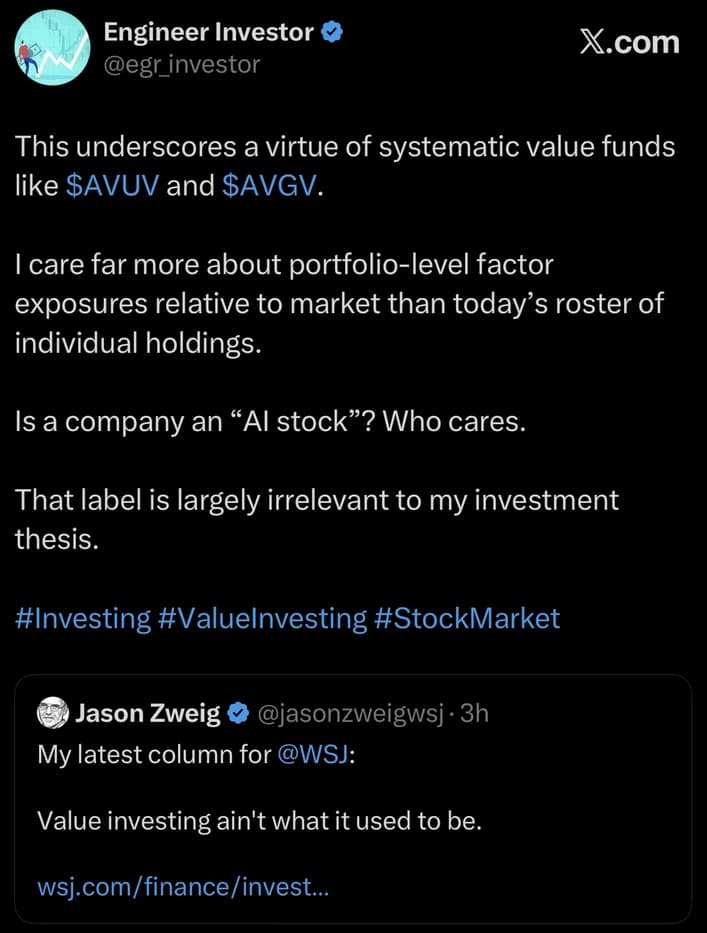
From my Engineer Investor account (@egr_investor) on X, Nov 13, 2026.
Disclosure: I write both Summitward and the Engineer Investor account.
A claim about exposures can be checked. I pulled the holdings of nine value ETFs, measured how each one moved from Nvidia’s October 6 peak through November 12, estimated how much each tracks semiconductor stocks, and regressed their returns on the Fama-French factors. The results support part of my post and complicate another part.
The short version
Value ETFs differ widely in what AI-linked stocks they own. On November 12, 2026, VLUE had 18.6% in Micron, the Russell 1000 Value fund held Microsoft and Apple but no Micron, and AVUV and DFSV held none of the large AI names I checked. From October 6 to November 12, every value fund here except VLUE beat the total market, which fell 2.6%, mostly for reasons other than their measured sensitivity to chip stocks. Holding AI names did not stop a fund from carrying a value tilt: Avantis’s large-cap value fund holds Microsoft, Meta and Micron, and over five years its value and profitability loadings are statistically indistinguishable from the Russell index fund’s. The clearest evidence that a systematic process changes exposure comes from small-cap value.
What nine value ETFs hold
The nine funds cover the main ways a value ETF gets built: three that track traditional style indexes (VTV, IWD, IVE), one that tracks a concentrated factor index (VLUE), and five actively managed systematic funds from Avantis and Dimensional. VTI, the total U.S. market, is the reference row.
| Fund | Index or manager | Stocks | Net expense | Tech + comm. services |
|---|---|---|---|---|
| VTV | Morningstar US Large Cap Value (formerly CRSP) | 298 | 0.03% | 15.8% |
| IWD | Russell 1000 Value | 868 | 0.18% | 22.0% |
| IVE | S&P 500 Value | 434 | 0.18% | 22.1% |
| VLUE | MSCI USA Enhanced Value | 146 | 0.15% | 47.8% |
| AVLV | Avantis, large-cap value | 298 | 0.15% | 20.4% |
| DFLV | Dimensional, large-cap value | 333 | 0.21% | 14.7% |
| AVUV | Avantis, small-cap value | 784 | 0.25% | 7.0% |
| DFSV | Dimensional, small-cap value | 1,057 | 0.27% | 9.1% |
| AVGV | Avantis, global value (six Avantis ETFs) | 6 funds | 0.26% | 13.1% |
| VTI | Total U.S. market (reference) | 3,431 | 0.03% | 46.5% |
Holdings as of Nov 12, 2026, except VTV and VTI (Sep 30, 2026, Vanguard’s latest posted file). Stocks counts the stock lines in each issuer’s file; share classes count separately. Sector weights are GICS Information Technology plus Communication Services: as iShares and Avantis classify them, Dimensional’s own Oct 31 figures, and for VTV and VTI Summitward’s mapping of Vanguard’s sub-industry labels to GICS sectors. AVGV is looked through to its sleeves. AVGV’s expense ratio includes the fees of the ETFs it holds. Source: issuer holdings files and fund pages; Summitward calculations.
| Fund | Microsoft | Apple | Meta | Nvidia | Micron | Sandisk |
|---|---|---|---|---|---|---|
| VTV | – | – | – | – | 4.56% | – |
| IWD | 5.05% | 6.12% | 0.65% | – | – | – |
| IVE | – | 8.41% | – | – | – | – |
| VLUE | – | – | – | – | 18.63% | – |
| AVLV | 3.40% | 2.91% | 2.93% | 0.17% | 2.59% | 0.39% |
| DFLV | – | – | 1.99% | – | 0.10% | <0.01% |
| AVUV | – | – | – | – | – | – |
| DFSV | – | – | – | – | – | – |
| AVGV (look-through) | 1.29% | 1.10% | 1.11% | 0.06% | 0.98% | 0.15% |
| VTI | 5.19% | 6.63% | 2.18% | 7.13% | 1.64% | 0.35% |
Weight in each fund, same dates as above. A dash means the fund does not hold the stock. DFLV also holds Alphabet (1.53% across both share classes). AVUV and DFSV hold none of these six or Alphabet, Broadcom, Oracle or AMD.
The same word covers very different portfolios. VLUE’s technology and communication weight, 47.8%, is about six points above the iShares Russell 3000 ETF’s 42.0% on the same date, and a single chipmaker is almost a fifth of the fund. VTV’s largest holding was Micron. IWD holds 11% in Apple and Microsoft combined and no Micron or Sandisk. AVLV holds all six, including Microsoft, Apple, Micron and Sandisk, which Zweig’s column names. AVUV and DFSV hold none of the ten AI-linked companies I checked.
AVGV is the fund in my post with AI exposure. AVLV is 37.8% of it, so AVGV owns roughly 1% each in Microsoft, Apple, Meta and Micron through that sleeve. The rest of AVGV sits in AVUV (18.0%), international large and small value (AVIV 17.7%, AVDV 9.0%), emerging-markets value (AVES 9.8%) and U.S. mid-cap value (AVMV 7.6%).
How each index decides what counts as value
Each provider scores value differently, and the differences explain most of the table above.
| Index or manager | Value is measured by | Funds |
|---|---|---|
| FTSE Russell | Book-to-price only, as half of a composite score; the other half is forecast two-year earnings growth and five-year sales growth. Stocks can be split between value and growth. | IWD |
| Morningstar (formerly CRSP) | Five ratios: book, forward earnings, trailing earnings, dividends and sales, each to price | VTV |
| S&P | Book, earnings and sales, each to price; changes on Dec 21, 2026 (below) | IVE |
| MSCI USA Value | Book-to-price, forward earnings-to-price, dividend yield | None in this comparison |
| MSCI USA Enhanced Value | Forward price-to-earnings, enterprise value to operating cash flow and price-to-book, scored within each sector | VLUE |
| Avantis | Mainly adjusted book-to-price, with a profitability measure (adjusted cash from operations to book) | AVLV, AVUV, AVGV |
| Dimensional | Mainly price-to-book, with price-to-cash-flow or earnings as possible inputs; may overweight higher-profitability stocks | DFLV, DFSV |
Sources: FTSE Russell US index methodology v7.4; Morningstar Market Indexes methodology (July 2026); S&P U.S. Style Indices methodology; MSCI value and growth methodology; MSCI Enhanced Value methodology; Avantis and Dimensional summary prospectuses.2345678
Russell’s method relies most on book value, which is how Micron and Sandisk ended up in the Russell 1000 Value index and then left it. In the first ten months of 2026 the index’s technology sector gained 88.5% and the index returned 24.5%, while the Russell 1000 Growth fell 0.2%, according to Zweig.1 The iShares funds that track the two indexes returned 24.3% and −0.3% over the same span. Both stocks’ prices rose sharply before the April 30 rank date, which lowers book-to-price, and at the June 2026 reconstitution FTSE Russell moved Micron and Sandisk from 0% growth to 100% growth, tying the shifts to the strength of semiconductor stocks and AI. The same review moved Microsoft to a 50/50 split and Apple to 46% value, which is why IWD now holds both.9
Russell switched to twice-yearly reconstitution in 2026, with the first December changes taking effect after the close on December 11. The December review sets style weights only for new members and companies changing size groups, so existing members keep their June splits.210 On my reading of those rules, Micron and Sandisk stay in the growth index until at least June 2027. Zweig reports that FTSE Russell is considering adding criteria to its value definition.
Book value is the weak link. Accounting rules expense most spending on research, software and brands instead of recording it as an asset, so companies that build those assets show little book equity and look expensive on price-to-book, while capital-heavy chipmakers look cheap. Eisfeldt, Kim and Papanikolaou add estimated intangible capital to book equity; in their 1975–2018 sample the intangible-adjusted value factor beat the standard one by about 2.1 percentage points a year, and the gap was larger after 2007.11 Arnott, Harvey, Kalesnik and Linnainmaa find that the cheapening of value stocks relative to growth stocks explains all of value’s 2007–2020 drawdown, and that a value measure adjusted for intangibles performs much better.12 S&P’s style indexes will move to an intangibles-adjusted book-to-price, and add free cash flow to price, on December 21, 2026.4
How value funds did in the AI selloff
Nvidia and the Russell 1000 Growth ETF both made their highest close of the autumn on October 6, the date Zweig gives for the peak of the AI trade. Through November 12, the day before his column, Nvidia fell 30.5% and the iShares Semiconductor ETF (SOXX) fell 21.1%.
Over those five weeks, every value fund except VLUE did better than the total market. The traditional index funds did best, VTV, IWD and IVE each gaining a little over 4%. VLUE lost 4.9%, about 2.3 points worse than VTI and close to the −5.3% its market and semiconductor coefficients (below) predict for the window. AVLV gained 2.2%, about two points less than IWD.
Small-cap value held up less well than large-cap value: AVUV gained 1.1% and DFSV 2.1%. Zweig calls small value the corner of the market most remote from the AI boom, and the holdings agree. In this window that distance did not translate into the best return. Five weeks is too short to say why, and a window that starts at a peak chosen after the fact flatters whatever held the least of what fell.
Semiconductor sensitivity, measured from returns
A holdings list says what a fund owns today. A regression says how its returns have moved. I regressed each fund’s weekly returns on VTI and on the return of SOXX minus VTI, from June 29, 2023 (AVGV’s first close in the Yahoo data) to November 12, 2026. The second coefficient measures how a fund moves with chip stocks beyond what its market exposure explains. A value of −0.10 means that in a week when chip stocks beat the market by 10 points, the fund trailed its market-only prediction by about 1 point, and gained about 1 point when chips lagged.
| Fund | Semiconductor coefficient | 95% interval | Through Oct 1, 2026 |
|---|---|---|---|
| VLUE | +0.17 | +0.07 to +0.27 | +0.16 |
| IWF (growth) | +0.09 | +0.04 to +0.14 | +0.06 |
| AVLV | −0.03 | −0.08 to +0.02 | −0.01 |
| AVGV | −0.03 | −0.08 to +0.01 | −0.02 |
| VTV | −0.06 | −0.11 to −0.003 | −0.05 |
| DFLV | −0.06 | −0.11 to −0.001 | −0.04 |
| AVUV | −0.08 | −0.15 to −0.01 | −0.07 |
| IWD | −0.10 | −0.14 to −0.05 | −0.08 |
| DFSV | −0.11 | −0.17 to −0.05 | −0.10 |
| IVE | −0.11 | −0.14 to −0.08 | −0.11 |
Weekly (Thursday-close) returns, Jul 2023 to Nov 12, 2026, 176 weeks; regression on VTI and SOXX minus VTI; Newey-West intervals. The last column ends the sample Oct 1, 2026, before the selloff. Source: Yahoo Finance; Summitward calculations.
Most value funds have moved slightly against chip stocks since mid-2023. The negative coefficients also appear in the sample that ends before the selloff, though for VTV, DFLV and AVUV that shorter sample’s intervals include zero. VLUE runs the other way and has moved with semiconductors for the whole period. AVLV and AVGV sit near zero; the regression does not say which holdings produce that. Regressing AVGV’s return minus IWD’s on the same two factors gives a semiconductor gap of +0.065 (95% interval +0.037 to +0.092), so AVGV, which I own, offsets chip-stock moves measurably less than the Russell index fund. I hold AVGV for a persistent global value tilt, as my AVGV review explains, so this does not change why I own it. If you want a value fund to offset chip stocks, check this number.
These coefficients explain little of the selloff itself. Chip stocks trailed the market by 18.5 points over the five weeks, so the semiconductor term accounts for 0.6 to 2.1 points of the other eight value funds’ 2.5 to 7.2 points of outperformance; IWD, for example, beat VTI by 7.0 points, and its coefficient explains 1.8 of them. The rest looks like a broader move from growth to value that the chip coefficient does not capture: the Russell 1000 Growth ETF fell 5.4 points more than its own coefficients predict. VLUE is the exception, returning −4.9% against a predicted −5.3%.
What the factor loadings show
My post said I care about factor exposures relative to the market, so those deserve a direct test. The table shows each fund’s loadings on the Fama-French five factors over its own history. A value loading of 0.30 means the fund behaves as if about 30% of it were the long-short value factor, on top of its market exposure.
| Fund | Window | Market | Size | Value | Profitability | Investment |
|---|---|---|---|---|---|---|
| VTV | 2004–2026 | 0.90 | −0.07 | 0.30 | 0.07 | 0.18 |
| IWD | 2000–2026 | 0.93 | −0.03 | 0.31 | 0.09 | 0.15 |
| IVE | 2000–2026 | 0.93 | −0.07 | 0.28 | 0.01 | 0.14 |
| VLUE | 2013–2026 | 1.05 | −0.04 | 0.43 | −0.29 | 0.06 |
| AVLV | 2021–2026 | 1.00 | 0.18 | 0.29 | 0.07 | 0.18 |
| DFLV | 2023–2026 | 0.91 | 0.04 | 0.54 | 0.05 | 0.14 |
| AVUV | 2019–2026 | 1.06 | 0.89 | 0.55 | 0.22 | −0.05 |
| DFSV | 2022–2026 | 1.01 | 0.86 | 0.44 | 0.20 | 0.10 |
| IWN (Russell 2000 Value) | 2000–2026 | 0.96 | 0.83 | 0.38 | 0.08 | 0.07 |
| VTI | 2001–2026 | 1.00 | 0.00 | 0.02 | 0.02 | 0.01 |
| IWF (Russell 1000 Growth) | 2000–2026 | 1.06 | −0.14 | −0.26 | −0.04 | −0.13 |
Monthly excess returns, each fund’s first full month through Sep 2026; regression on the five Fama-French factors plus momentum (momentum not shown). US factors do not describe a global fund, so AVGV is left out. DFSV is the stand-alone ETF’s own record; since September 25, 2026 the ticker reports DFSVX’s history back to 1993. Source: Ken French data library, Yahoo Finance; Summitward calculations.13
Every value fund loads positively on value and the growth fund loads negatively, so the labels point the right way. Over the common window of January 2023 to September 2026, the large-cap value loadings run from 0.32 for AVLV to 0.60 for VLUE, with IWD at 0.41 and DFLV at 0.54, each with an interval of roughly ±0.2 to ±0.3. VLUE, the fund with the largest single AI position, has the highest of them, along with a negative profitability loading (−0.29 over 2013–2026, not statistically significant; −0.57 over 2023–2026), a tilt toward cheap, less profitable companies. Holding a large chip position did not keep VLUE from loading heavily on value.
Comparing two funds by subtracting their loadings mixes windows and ignores sampling error. The better test regresses the difference in their returns on the factors over the shorter fund’s history:
| Comparison | Window | Value gap | Profitability gap |
|---|---|---|---|
| AVLV minus IWD | Oct 2021–Sep 2026 | +0.00 (−0.14 to +0.15) | −0.04 (−0.14 to +0.06) |
| DFLV minus IWD | Jan 2023–Sep 2026 | +0.13 (+0.04 to +0.22) | −0.08 (−0.16 to −0.005) |
| VLUE minus IWD | May 2013–Sep 2026 | +0.14 (+0.01 to +0.26) | −0.38 (−0.78 to +0.02) |
| AVUV minus IWN | Oct 2019–Sep 2026 | +0.15 (+0.04 to +0.26) | +0.23 (+0.07 to +0.38) |
| DFSV minus IWN | Mar 2022–Sep 2026 | +0.05 (−0.11 to +0.20) | +0.20 (+0.12 to +0.29) |
Monthly return differences regressed on the five factors plus momentum; 95% Newey-West intervals in parentheses. Source: Ken French data library, Yahoo Finance; Summitward calculations.
Over its five-year history, AVLV’s value and profitability loadings are statistically indistinguishable from IWD’s; the value gap’s interval runs from −0.14 to +0.15. That is not what the holdings characteristics suggest: Avantis’s September 30 fact sheet shows AVLV at a book-to-market of 0.26 against the Russell 1000 Value’s 0.19, and profits-to-book of 0.58 against 0.42.14 A fact sheet describes one day’s portfolio; a loading averages five years of co-movement, and Avantis’s cash-based profitability measure differs from the operating-profitability sort behind the Fama-French factor. AVLV did return 15.1% a year against IWD’s 12.5% from October 2021 to October 2026. Its higher market exposure (a beta gap of 0.11) accounts for about a point a year; the remaining 1.7 points a year is well within what 4.6 points of annual tracking error produces by chance over five years.
DFLV and VLUE both show measurably more value exposure than IWD, and DFLV does it without VLUE’s concentration. DFLV’s fact sheet agrees: a lower price-to-book than the Russell 1000 Value (2.68 against 3.16) and lower profitability (0.30 against 0.41).15 In small caps the systematic funds differ clearly from the index. AVUV adds value and profitability exposure over the Russell 2000 Value fund. DFSV adds profitability exposure but not measurably more value.
For my post, this splits two ways. Against the market, which is the comparison I named, AVLV, AVGV’s largest sleeve, carries a real value tilt: 0.32 against VTI’s 0.02 over January 2023 to September 2026. Against the Russell index fund, its returns do not yet show more. The AVUV part of the claim holds up well. On AI names, this is illustration rather than proof: funds holding AI-linked companies (AVLV, VLUE) and funds holding none (AVUV, DFSV) all carry clear value loadings, which fits my view that the label does not decide a fund’s exposure.
Why I don’t screen out AI companies
A stock’s expected return depends on the price paid for its future cash flows. Two companies with the same expected cash flows, one priced lower, imply a higher expected return on the cheaper one, whatever industry it is in. The valuation and profitability evidence is built on that logic, and none of it depends on whether a company is called an AI company. Fama and French find that once profitability and investment factors are in the model, their value factor becomes redundant for describing average returns in U.S. data from 1963 to 2013.16 Novy-Marx finds that gross profitability predicts returns about as well as book-to-market.17 The explanations for the value premium disagree. Lakonishok, Shleifer and Vishny argue that investors extrapolate past growth too far; Zhang argues that firms with heavy fixed assets are harder to shrink in bad times and so riskier.1819 Both explanations work through prices and fundamentals.
Removing AI companies from a value fund would be a sector bet layered on a factor bet, with more tracking error and no premium behind it. If a chipmaker is cheap relative to its book value and profits, excluding it means paying more for the rest of the portfolio. I would rather own a process that applies the same valuation rules to every company and check, from returns, what that process produces.
The label still matters in one case: when a theme concentrates in a few positions. VLUE’s chip weight came from its index rules, and it showed up in the semiconductor coefficient and in the selloff. The exposure measures caught it.
Where this approach can fail
- Concentration can hide inside a value label. VLUE’s 18.6% Micron position is the example here, and Summitward’s VLUE and Micron guide covers how its index rules produced it.
- The value premium has gone missing for long stretches. In Ken French’s data the value factor averaged 5.3% a year from July 1926 to December 2007 and −0.6% a year from January 2008 to September 2026 (arithmetic means). Li, Ng and Swaminathan report 5.20% for the same early window and −0.86% through March 2025; French revises his library from time to time, which accounts for small differences.20 Zweig cites Dimson, Marsh and Staunton: U.S. value trailed growth by 3.1 points a year from 2008 through 2025, and large value still beat large growth over 1927–2025, 12.3% to 10.2% a year.1 Ken French’s portfolios give the same 12.3% and 10.2% (see Small-Cap Value vs. Small-Cap Growth).
- A value tilt holds less of the biggest winners. Bessembinder found that about 4% of U.S. listed companies account for all of the stock market’s gain over Treasury bills from 1926 to 2016.21 A cap-weighted fund owns them as they grow; a value fund often sells them as their prices rise, as Russell did with Micron in June.
- Published premiums shrink. McLean and Pontiff found that returns on 97 published predictors fell 58% on average after publication.22
- Tilts cost more and swing more. VTI charges 0.03%; AVGV 0.26% and AVUV 0.25%. From October 2019 to October 2026, AVUV compounded at 15.4% a year against VTI’s 15.2%, with 25.4% annual volatility against 17.0%.
- Timing the rotation is unreliable. Dimensional’s Wes Crill told Zweig the firm finds no short-term predictability in the value premium.1 Li, Ng and Swaminathan find that an implied value premium built from analyst forecasts does predict value returns out of sample, with an R-squared of about 2% to 3% over December 2000 to December 2023, which leaves most of the variation unexplained.20
What I recommend
If you want an AI hedge
Decide that you want one, then measure it. Over July 2023 to November 2026, most value funds moved slightly against chip stocks, VLUE moved with them, and AVLV and AVGV were close to neutral. The five weeks after October 6 favored value funds by far more than those coefficients explain, so do not count on a repeat. A broad index investor who plans to hold for decades probably does not need a hedge at all, which is also where Zweig ends his column. The direct way to own less AI is to own less of it, and a value or small-value sleeve does that only as a side effect.
If you want the value premium
Choose on method and measured exposure. A value loading clearly above the market’s, a profitability screen (in small caps, AVUV and DFSV carry measurably more profitability exposure than the Russell 2000 Value fund; the large-cap funds here show no such gap), no single position large enough to dominate the fund, and a cost you can justify. Then plan to hold through a stretch like 2008–2025, because the premium has never arrived on a schedule.
What to check once a year
- Each fund’s value, profitability and size loadings against VTI and against its index peer.
- Its largest single position and its sector weights against the market.
- Its semiconductor coefficient, so I know whether my value sleeve offsets or adds to the market’s chip weight.
- Cost and tracking difference after fees.
Whether any holding is called an AI stock is not on the list.
Measure your own value tilt
Summitward's Portfolio tab runs Fama-French factor regressions on your holdings and shows your largest positions and concentration.
Open portfolio analysisFrequently asked questions
Is Microsoft a value stock?
It depends on the index. After the June 2026 reconstitution Russell counts Microsoft as half value and half growth, so IWD held 5.05% on November 12, 2026. Microsoft is the largest holding in the MSCI USA Value index, at 10.91% on October 30, 2026.23 VTV (Morningstar, September 30 holdings) and IVE (S&P 500 Value, November 12) did not hold it; S&P’s December 21 methodology change could alter IVE’s list.
Does VTV hold AI stocks?
Its largest holding on September 30, 2026 was Micron, at 4.56%. It held no Microsoft, Apple, Meta or Nvidia, and 15.8% of the fund was in technology and communication services.
Does AVUV own AI stocks?
None of the large AI-linked companies I checked. Its technology and communication services weight was 7.0% on November 12, 2026, and its returns have moved slightly against chip stocks since 2023.
Why did Micron leave the Russell 1000 Value index?
Russell scores value on book-to-price and growth on forecast earnings growth and past sales growth. After Micron’s price rose sharply before the April 30, 2026 rank date, its composite of those measures put it entirely in growth at the June reconstitution, and existing members keep their June style weights at the December review.
Is a value ETF a good hedge against an AI selloff?
It depends on the fund, and the offset is small. From October 6 to November 12, 2026, IWD gained 4.4% while VTI lost 2.6% and VLUE lost 4.9%, but that window starts at a peak picked after the fact, and most of the gap came from something other than sensitivity to chip stocks. Over 2023–2026, most value funds moved only slightly against chip stocks. Check a fund’s holdings and its measured sensitivity before counting on it.
Is the value premium dead?
It has been weak since 2008: the Fama-French value factor averaged −0.6% a year from January 2008 to September 2026. Over the full record from July 1926 to September 2026 it averaged 4.2% a year, positive in 53% of months. Li, Ng and Swaminathan, whose paper asks this question, find that the expected value premium rises and falls over time and can be partly forecast from analysts’ earnings expectations.20
Key takeaways
- “Value” covers very different portfolios. On November 12, 2026, VLUE had 18.6% in Micron, IWD held Microsoft and Apple without Micron, and AVUV and DFSV held none of the large AI names checked.
- Book value drives the surprises. Russell scores value on book-to-price alone, which kept capital-heavy Micron and Sandisk in its value index until their price gains moved them to growth at the June 2026 reconstitution.
- Most value funds move slightly against chip stocks. Over July 2023 to November 2026 their semiconductor coefficients ran from −0.11 to −0.03, and VLUE’s was +0.17. In the October 6 to November 12, 2026 selloff every value fund here except VLUE beat the total market, mostly for other reasons.
- Holding AI names did not prevent a value tilt. Over October 2021 to September 2026, AVLV, which holds Microsoft, Meta and Micron, had value and profitability loadings statistically indistinguishable from IWD’s.
- Measure the exposure. Loadings against the market and against an index peer, the largest position and the chip-stock coefficient say more than any holding’s label.
Related guides
- Is the Value Premium Back?: what drove small-cap value’s 2025–26 run and how cheap value stocks still are.
- When a Value ETF Becomes a Tech Bet: how VLUE’s index rules concentrated it in Micron.
- Do Higher Factor Loadings Mean Higher Expected Returns?: how precisely loadings and premiums are known.
- AVGV Review: what the one-ticker global value fund holds and why I own it.
- Small-Cap Value vs. Small-Cap Growth: 99 Years of Data: the long record behind the small-value tilt.
- Cheap for a Reason: Value Traps: why diversified value survives the companies that deserve their low prices.
- Idiosyncratic Risk: how much of Nvidia’s fall reached index investors.
- Growth Stocks Do Not Mean Higher Expected Returns: why the price paid sets the expected return.
Sources
- Jason Zweig, “The Stock Market’s Bargain Bin Is Secretly Stuffed With AI Stocks,” The Wall Street Journal, Nov 13, 2026. wsj.com
- FTSE Russell, Russell US Equity Indexes Construction and Methodology, v7.4, Nov 2026, section 8. lseg.com
- Morningstar, Morningstar Market Indexes Methodology Guide (formerly CRSP US equity indexes), July 2026. indexes.morningstar.com
- S&P Dow Jones Indices, “S&P U.S. Style Indices Consultation on the Growth and Value Factors Framework – Results,” Oct 23, 2026 (current and new factors). spglobal.com
- MSCI, Global Investable Market Value and Growth Index Methodology, section 1.2.1. msci.com
- MSCI, Enhanced Value Indexes Methodology. msci.com
- Avantis U.S. Large Cap Value ETF and Avantis U.S. Small Cap Value ETF, summary prospectuses, Jan 1, 2026. AVLV, AVUV
- Dimensional US Large Cap Value ETF, summary prospectus, Feb 28, 2026. sec.gov
- FTSE Russell, “Growth, value or both? Key style shifts in the June 2026 Russell reconstitution,” June 2026. lseg.com
- FTSE Russell, “FTSE Russell announces December 2026 Russell US Indexes reconstitution schedule.” lseg.com
- Andrea L. Eisfeldt, Edward Kim and Dimitris Papanikolaou, “Intangible Value,” Critical Finance Review 11(2), 2022. doi.org; working paper: NBER w28056
- Robert D. Arnott, Campbell R. Harvey, Vitali Kalesnik and Juhani T. Linnainmaa, “Reports of Value’s Death May Be Greatly Exaggerated,” Financial Analysts Journal 77(1), 2021. doi.org
- Kenneth R. French, Data Library: Fama/French 5 Factors (2x3), Momentum Factor and Fama/French 3 Factors, monthly, through Sep 2026. mba.tuck.dartmouth.edu
- Avantis U.S. Large Cap Value ETF fact sheet, Sep 30, 2026. avantisinvestors.com
- Dimensional US Large Cap Value ETF fact sheet, Sep 30, 2026. dimensional.com
- Eugene F. Fama and Kenneth R. French, “A Five-Factor Asset Pricing Model,” Journal of Financial Economics 116(1), 2015. doi.org
- Robert Novy-Marx, “The Other Side of Value: The Gross Profitability Premium,” Journal of Financial Economics 108(1), 2013. doi.org
- Josef Lakonishok, Andrei Shleifer and Robert W. Vishny, “Contrarian Investment, Extrapolation, and Risk,” Journal of Finance 49(5), 1994. doi.org
- Lu Zhang, “The Value Premium,” Journal of Finance 60(1), 2005. doi.org
- Yan Li, David T. Ng and Bhaskaran Swaminathan, “Is the Value Premium Dead? Forecasting Value–Growth Cycles with the Implied Value Premium,” Journal of Financial and Quantitative Analysis 61(5), 2026 (online Feb 2026). doi.org
- Hendrik Bessembinder, “Do Stocks Outperform Treasury Bills?” Journal of Financial Economics 129(3), 2018. doi.org
- R. David McLean and Jeffrey Pontiff, “Does Academic Research Destroy Stock Return Predictability?” Journal of Finance 71(1), 2016. doi.org
- MSCI USA Value Index (USD) factsheet, Oct 30, 2026. msci.com
Method
Holdings: issuer files read Nov 13, 2026 (iShares, Avantis and Dimensional as of Nov 12; Vanguard as of Sep 30, its latest posted month end). AVGV’s figures weight each sleeve’s holdings by its share of AVGV. Returns: Yahoo Finance dividend-adjusted closes. Semiconductor coefficient: weekly Thursday-close returns, Jun 29, 2023 to Nov 12, 2026, regressed on VTI and SOXX minus VTI, Newey-West (4 lags). Loadings: monthly returns in excess of the one-month Treasury rate, regressed on the Fama-French five factors and momentum, Newey-West (6 lags); gaps regress one fund’s return minus another’s on the same factors. These describe past windows and are not forecasts. The scripts, holdings files and output are in summitward-research.
Author disclosure
I hold AVGV and other Avantis value funds. Summitward has no business relationship with Avantis, Dimensional, Vanguard, BlackRock or any firm mentioned here and receives no compensation from them. Nothing here is investment advice.
More in Investing & Portfolio
Browse all investing & portfolio guidesGet new guides by email
Evidence-based, no jargon. At most two emails a month. Unsubscribe any time.
Try it in Summitward
See portfolio factor analysis in action with your own financial data. Free to start, no credit card required.