

Idiosyncratic Risk: What Nvidia's CEO Exit Means for Index Fund Investors
Over 2023 to 2026, Nvidia's own news drove 59% of its stock's risk and 2.3% of an S&P 500 fund's. What idiosyncratic risk is, and what Jensen Huang's exit cost.
On November 11, 2026, Nvidia’s board accepted Jensen Huang’s resignation as president, chief executive and director, effective immediately. Huang co-founded the company in 1993 and had run it ever since. Chief financial officer Colette Kress became interim CEO, and Harvey Jones, a director since 1993, became what Nvidia called the board’s first-ever chair.12 By the November 11 close the stock was down 19% from October 28, the day before the first spy report, and it opened more than 13% lower on November 12 after the announcement.3 It recovered part of that during the day and closed 4.3% lower, 22.8% below its October 28 close.
Many of the people who lost money on Nvidia this week never chose to buy it. Nvidia was 6.39% of the SPDR S&P 500 ETF on November 11,4 and 56% of U.S. families own stock directly or through funds and retirement accounts.5 That raises a practical question about idiosyncratic risk, the part of a stock’s movement that comes from the company itself: how much of one company’s bad news reaches someone who owns the whole market?
I put the short version on my Engineer Investor account:
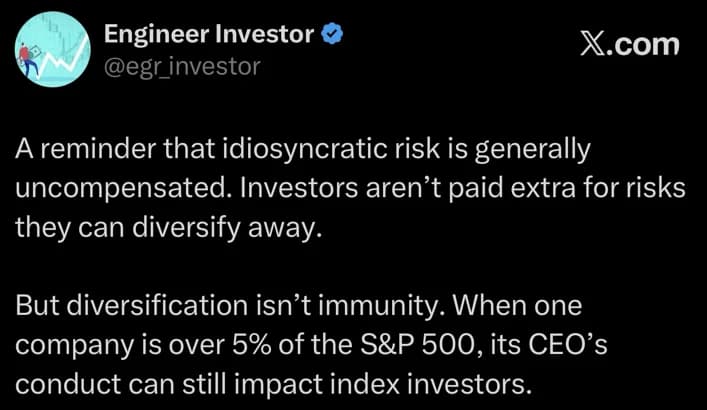
From my Engineer Investor account (@egr_investor) on X, Nov 12, 2026.
Disclosure: I write both Summitward and the Engineer Investor account.
The short version
Idiosyncratic risk comes from the company itself: its CEO, its products, its lawsuits. Diversification removes most of it, which is why markets do not reliably pay extra for bearing it. In a cap-weighted fund it shrinks in proportion to each company’s weight and never reaches zero. Over the three years before this week, Nvidia’s company-specific moves made up about 59% of the variance of holding Nvidia alone, 2.3% of an S&P 500 fund’s and 0.9% of a global fund’s. For an S&P 500 investor the company-specific part of the scandal cost about 1.2 percentage points. For a concentrated holder it is a different problem, and the fix is position size.
What happened, and what Nvidia has confirmed
Nvidia’s own filings say little. The November 12 Form 8-K reports the resignation, the interim CEO and the new chair, and gives no reason.1 The accompanying release says the company expects its “operations, customer commitments and product roadmap to continue without interruption.”2 In a November 8 letter to employees, Huang wrote that he had been unfaithful to his wife and that “there is no excuse for what I did,” and referred to “the national security concerns raised in news reports.”6 The board opened an independent investigation the same day and on November 10 retained former acting U.S. Attorney Joon Kim and the law firm Wachtell, Lipton, Rosen & Katz.7
The rest comes from reporting. On October 29, The New York Times reported, citing people briefed on classified intelligence, that U.S. officials had concluded that an executive at the data-center company Megaspeed who had a close relationship with Huang was a Chinese intelligence asset. Later Times reports tied her to China’s Ministry of State Security and said Huang had acknowledged an intimate relationship with her to the board.89 No charges have been filed, officials have not made evidence public, and China’s foreign ministry called the allegation “purely unsubstantiated.”10 On November 11 the Times reported a second relationship, with a subordinate, citing five people who worked at Nvidia, and The Wall Street Journal reported that the board was preparing to remove him.9 A proposed securities class action filed November 9 in federal court in San Jose alleges that Nvidia misled investors; its claims are untested.11
Nothing below depends on which of these reports proves true. What matters to a shareholder is that one person’s conduct moved the price of a company worth about $5.2 trillion on October 28.
How much of the fall was Nvidia’s own news
From the October 28 close through November 6, Nvidia fell 13.3%. Against the S&P 500, which fell 4.8%, that looks like a company-specific loss. Against other chip stocks it looks like the reverse: SOXX, the iShares Semiconductor ETF, fell 21.5% over the same seven sessions in an industry-wide selloff. Nvidia did better than its industry while the spy story was building.
A raw comparison also ignores how much Nvidia normally moves with the market. Over the 250 trading days before October 28, its daily returns moved about 1.9 times as much as the S&P 500’s. An event study uses that history to predict what the stock should have done each day given what its benchmark did, and calls the difference the abnormal return:
Here is Nvidia’s return on day , is the benchmark’s, and and come from a regression over the estimation window. Summing the daily abnormal returns over a window gives the cumulative abnormal return. I ran it against three benchmarks:
| Window | Nvidia, raw | vs. S&P 500 | vs. chip stocks | vs. both |
|---|---|---|---|---|
| Oct 29 to Nov 6 (spy reports, chip selloff) | -13.3% | -4.1% (t = -0.9) | -2.2% (t = -0.4) | -1.8% (t = -0.4) |
| Nov 9 to Nov 12 (Huang’s letter to resignation) | -11.0% | -16.8% (t = -4.7) | -17.3% (t = -4.6) | -17.8% (t = -5.1) |
Cumulative abnormal returns from market models fitted on daily returns, Oct 29, 2025 to Oct 27, 2026. S&P 500 = SPY; chip stocks = SOXX; “both” uses SPY and SOXX together. t-statistics use the estimation-window residual volatility. Source: Yahoo Finance adjusted closes; Summitward calculations.
In the first window, no benchmark finds an abnormal return that stands out from ordinary noise. Nvidia’s high beta and the chip selloff account for its fall, and the October 29 report barely registered. In the second window, after Huang’s letter, every benchmark finds an abnormal loss of roughly 17% in four sessions, with t-statistics around -5. That part was Nvidia’s own news, and it holds whichever benchmark you pick.
Two limits apply. SPY and SOXX both hold Nvidia, so part of Nvidia’s own drop sits inside the benchmark, which makes the abnormal returns slightly too small. And an event study measures how the market repriced the stock on the news, which can differ from the damage the business eventually suffers in either direction.
Systematic and idiosyncratic risk
The standard way to split a stock’s risk is the one-factor market model:
is the stock’s return, the market’s, the stock’s sensitivity to the market, and the company-specific remainder. If that remainder is uncorrelated with the market, the stock’s variance splits into two pieces:
Measured against the global stock market with weekly returns over the three years to October 23, 2026, the idiosyncratic piece was 59% of Nvidia’s variance. Its company-specific volatility was 33.7% a year, against 43.8% in total.
Diversification attacks the second piece. Hold stocks in equal weights, assume each has the same residual variance and that the residuals are uncorrelated with each other, and the portfolio’s idiosyncratic variance falls to
Real portfolios break both assumptions. Companies in one industry share shocks, which is why an export rule or a slowdown in AI spending hits chip stocks together, and index funds hold stocks by market value rather than in equal weights. The systematic piece does not shrink at all, however many stocks you add.
Lists of idiosyncratic risk sources usually include key-person risk, operational risk and regulatory risk. Nvidia’s week was mostly the first. Regulatory risk is the least clean of the three, because a rule that hits one chipmaker usually hits its peers. The same news can be idiosyncratic measured against the S&P 500 and systematic measured within the chip industry, which is exactly what the first window above showed.
Why the diversifiable part carries no reliable premium
In the capital asset pricing model, a stock’s expected excess return depends only on its beta:12
Company-specific volatility does not appear. The reasoning is that the investors who set prices hold diversified portfolios, so they need no extra return to hold risk that diversification removes at no cost to expected return. A stock does not earn more because its CEO might leave.
The empirical work agrees with that conclusion for investors and disagrees on the details. Ang, Hodrick, Xing and Zhang found that U.S. stocks with the highest idiosyncratic volatility trailed those with the lowest by 1.06% a month,13 and found the same pattern across 23 developed markets.14 Bali and Cakici showed that the result depends on method choices such as weighting and data frequency, and found no relation that held up across them.15 Fu, using forecasts of expected rather than past idiosyncratic volatility, found a positive one.16 Hou and Loh tested the proposed explanations and found that preferences for lottery-like payoffs and market frictions explained the most,17 consistent with evidence that stocks with extreme recent daily gains earn low subsequent returns.18 Taken together, the studies give no reliable evidence that bearing company-specific risk raises expected returns.
The strongest theoretical case for a premium comes from Robert Merton. In his 1987 model, investors know about only some stocks and hold under-diversified portfolios, so firm-specific risk is priced and less-followed stocks should earn more.19 That premium would go to holders of neglected stocks. Nvidia, a top-two holding in every major U.S. large-cap index fund, is the opposite case.
None of this says single stocks do badly. Nvidia ranks second, behind Apple, in Hendrik Bessembinder’s tally of lifetime shareholder wealth creation by U.S. stocks through 2025, at about $4.6 trillion.20 Most stocks go the other way: in his 1926-2016 sample, only 42.6% of U.S. stocks beat one-month Treasury bills over their lifetimes, and the best 4% accounted for all of the market’s net wealth creation.21 A winner identified after the fact does not show that its risk was compensated beforehand. The full argument is in most stocks lose to Treasury bills and compensated vs. uncompensated risk.
What reaches an index fund
For a fund holder, a company’s return reaches the portfolio in proportion to its weight. To a first approximation, the change in the fund’s value from one stock’s move is
where is the stock’s weight and its return. Nvidia fell 4.3% on November 12 from a 6.39% weight in SPY, which took about 0.28 percentage points off the fund that day; SPY ended the day down 0.4%, so the rest of the fund lost about 0.1%. Over the four sessions from November 9, Nvidia’s abnormal loss alone, weighted by its falling index weight, took about 1.2 points off an S&P 500 fund. For someone with $100,000 in the fund, that is roughly $1,200. Backing the weights out from prices, Nvidia was about 7.8% of SPY on October 28, so its total fall from then through November 12 subtracted about 1.8 points.
For scale, SPY’s daily returns had a standard deviation of 0.80% over the year before the first report. The company-specific part of Nvidia’s week cost an S&P 500 holder about what one or two ordinary bad days cost.
| Fund | Nvidia weight | Companies | Effective number | Top 10 share |
|---|---|---|---|---|
| S&P 500 (SPY) | 6.39% | 501 | 46 | 38.6% |
| Global (iShares ACWI) | 3.90% | 1,585 | 105 | 25.3% |
| Equal-weight S&P 500 (RSP) | about 0.2% | 501 | about 500 | about 2% |
| Small-cap value (IJS) | 0% | 459 | 283 | 9.0% |
Holdings as of Nov 11, 2026 (SPY, IJS) and Nov 10, 2026 (ACWI), from State Street and iShares; share classes of one company combined. RSP figures are its equal weights at quarterly rebalance; weights drift between rebalances. The iShares ACWI ETF holds a sample of the MSCI ACWI index. For comparison, Nvidia was 13.15% of the Technology Select Sector SPDR (XLK) on Nov 11.22 Source: issuer holdings files; Summitward calculations.
The “effective number” column measures how concentrated the weights are:
An equal-weighted portfolio of stocks has an effective number of exactly . SPY holds 501 companies, but its weights diversify company-specific risk about as well as 46 equally weighted stocks would. The global fund roughly doubles that. The next chart puts the two ideas together: Nvidia’s company-specific share of each holding’s variance, computed as
Over those three years, Nvidia’s own news made up about 2.3% of an S&P 500 fund’s variance and 0.9% of a global fund’s. Held alone, it was 59% of Nvidia’s variance. A portfolio with 10% in Nvidia directly and 90% in a global fund lands at 8.7%, about four times the S&P 500 fund’s share from a position many people would call modest. Measuring against the market and chip stocks together lowers every figure a little (to 50%, 7.4%, 1.9% and 0.8%), because part of what looked company-specific was industry-wide. A five-year window gives similar numbers.
Concentration at the top of the index makes this larger than it used to be. The ten largest companies were 38.6% of SPY on November 11, against a range of roughly 18% to 23% from 1990 to 2015.23 IBM was about 6.4% of the index in 1985.24 The effect also reaches past portfolios. Xavier Gabaix showed that when firm sizes are this skewed, shocks to individual firms do not average out in the economy either, and estimated that the idiosyncratic movements of the 100 largest U.S. firms explain about a third of the variation in output growth.25
What research says about losing a CEO
Nvidia’s most recent annual report warned that it was “highly dependent on the services of our longstanding executive team” and that poor succession planning could hinder its strategy and execution.26 It did not name Huang. Studies of executive departures find that the price effect depends on who leaves and why:
- Sudden deaths. Johnson, Magee, Nagarajan and Newman studied 53 sudden executive deaths and found that the reaction depended on founder status: prices on average rose when a founder died and fell when a non-founder did.27 Salas found an average reaction of +6.8% when an executive with more than ten years of tenure died after three years of poor stock performance.28 Using sudden deaths to measure what executives add, Nguyen and Nielsen estimated that the average top executive captures about 71% of the value they create in pay.29
- Personal scandals. Across 325 cases of executive misconduct, Cline, Walkling and Yore found an average immediate loss of 1.6% in shareholder value, rising to 4.1% when the CEO was involved, and a 41% higher chance that the CEO would leave.30
- Absence. Bennedsen, Pérez-González and Wolfenzon found that in Danish firms, mostly private, CEO hospitalizations reduced profitability and investment, while hospitalizations of other senior managers mattered less.31
- Founders. Fahlenbrach found that among large U.S. companies from 1993 to 2002, founder-led firms earned about 4.4% a year more than their benchmarks after controls.32
Nvidia’s abnormal loss of about 17% over four sessions is several times the 4.1% average for CEO misconduct. An event study cannot say why, but three features of this case plausibly contribute: Huang was a founder who ran the company for 33 years, so the market may credit him with an unusually large share of its value; the national-security angle raises the chance of regulatory consequences for a company whose sales already depend on export rules; and the departure came within days of the board’s investigation, which left little time for a planned succession.
What I recommend
If you own index funds
Do nothing because of this week. The company-specific part of Nvidia’s fall cost an S&P 500 holder about 1.2 points, and the rest of the index is still in the fund. That is diversification working as designed: it limits what any one company can do to you, without making losses impossible.
If single-company concentration still bothers you, broaden before you tilt. A global fund cuts Nvidia’s weight from 6.39% to 3.90% and its company-specific share of variance from 2.3% to 0.9% in the measurements above, and it diversifies country risk at the same time (see is VT the most diversified ETF?). Equal-weight and small-cap value funds cut Nvidia exposure to about zero, and small-cap value investors did have less of it this week. Those funds bring other exposures, though. Equal weight adds size, value and anti-momentum tilts and more turnover (is the S&P 500 a momentum trade?), and small-cap value is a factor bet that can trail the market for a decade (is factor investing dead?). Choose a tilt for its own expected premium and your tolerance for tracking error, with less Nvidia as a side effect.
If you own Nvidia directly
A single stock belongs in the speculative part of a portfolio, sized so that a large loss does not change your plan. For most investors that is roughly 0% to 5% of investable assets, as the risk budget guide argues. Lisa Meulbroek estimated that an employee holding a quarter of their assets in company stock gives up about 42% of that stock’s market value, measured as the certainty-equivalent cost of not being diversified.33 Above your cap, compare selling and holding after taxes: sell high-basis lots first, spread large gains across tax years, and consider giving appreciated shares instead of cash if you give to charity (donate stock or use a DAF). The concentration risk and when to sell a winning stock guides work through the sell-versus-hold math.
If you work at Nvidia, or any one company
Your salary, bonus, unvested stock and vested shares all depend on the same employer, and if you live near headquarters your home value may too. An employee’s brokerage account understates the concentration. Start with four exposures to one employer and sell your RSUs at vest.
When holding a large position is defensible
When the position is small relative to your net worth; when the embedded gain is very large and the shares are likely to receive a stepped-up basis at death in the near term; or when a lockup or blackout window prevents selling, in which case diversify everything else and stop adding. Conviction about the company is a weaker reason. Nvidia’s 17% abnormal loss after Huang’s letter came from news about one person, which no amount of research into its products would have anticipated.
See how concentrated your own portfolio is
Summitward's Portfolio tab reports your HHI, effective number of positions and largest holdings, the same concentration measures used in this guide.
Open portfolio analysisFrequently asked questions
What is idiosyncratic risk?
Idiosyncratic risk, also called unsystematic or company-specific risk, is the part of a stock’s return that comes from events at that company rather than from the market or its industry: a CEO departure, a product failure, a lawsuit or fraud. Holding many stocks reduces it, because one company’s surprise is a small part of a diversified portfolio.
Is idiosyncratic risk compensated?
Not reliably. Asset-pricing theory says investors are paid for systematic risk they cannot diversify away, and the volatility studies cited above, from Ang and coauthors to Hou and Loh, show no dependable return premium for company-specific volatility. Some find the most volatile stocks earn less. A stock can still do very well; its company-specific risk is not the reason to expect it to.
Does an S&P 500 fund protect me from one company’s problems?
It limits them. A company’s move reaches the fund in proportion to its weight, so a 13% fall in a 6% holding costs the fund about 0.8 points. Over 2023 to 2026, Nvidia’s company-specific moves were about 2.3% of an S&P 500 fund’s variance and 0.9% of a global fund’s.
How many stocks do you need to be diversified?
Statman put the number at 30 to 40 randomly chosen stocks,34 but Domian, Louton and Racine found that shortfall risk, the chance of ending below a target, keeps falling well past 100 stocks, because long-run returns are skewed toward a few winners.35 A broad index fund sidesteps the question.
Should I sell my index fund because of Nvidia?
No. The fund lost about 1.2 percentage points to Nvidia-specific news, and selling would trade a diversified holding for cash or a narrower one. If the concentration of the S&P 500 bothers you as a matter of design, a global fund reduces it.
Did Harry Markowitz say diversification is the only free lunch?
The line is widely attributed to him, but I could not find it in his 1952 paper or any other source in his own words, or any published source that traces it to him. What his 1952 paper does say is that “diversification cannot eliminate all variance,” because stock returns move together.36
Key takeaways
- Idiosyncratic risk is measured against a benchmark. Nvidia’s fall through November 6 looked company-specific against the S&P 500 and industry-wide against chip stocks; the loss after Huang’s letter was company-specific against both.
- Markets do not reliably pay for diversifiable risk. The CAPM predicts no premium, and two decades of research on idiosyncratic volatility have not turned up a dependable one.
- Index funds shrink company risk in proportion to weight. Over 2023 to 2026, Nvidia’s own news was about 59% of its stock’s variance, 2.3% of an S&P 500 fund’s and 0.9% of a global fund’s.
- Position size decides how much a scandal can hurt you. The company-specific news cost an S&P 500 holder about 1.2 percentage points and a direct holder about 17% of the position.
Related guides
- Compensated vs. Uncompensated Risk: how to spend a risk budget on risks the market pays for.
- Most Stocks Lose to T-Bills. The Market Still Wins.: why the market’s return comes from a few winners.
- Is VT the Most Diversified ETF?: covariance, and what more holdings do and do not buy.
- The Tech Bro Portfolio: how VOO, QQQ and NVDA overlap.
- Position Sizing: how big a single bet should be.
- Concentration Risk: the sell-versus-hold math for a large single-stock position.
Sources
- NVIDIA Corporation, Form 8-K (Items 5.02, 9.01), filed Nov 12, 2026. sec.gov
- NVIDIA, “NVIDIA Announces CEO Transition,” Nov 12, 2026. nvidianews.nvidia.com
- CNBC, Nvidia live updates, Nov 12, 2026. cnbc.com
- State Street Global Advisors, SPY daily holdings, as of Nov 11, 2026. ssga.com
- Federal Reserve Board, results of the 2025 Survey of Consumer Finances, Oct 9, 2026. federalreserve.gov
- Jensen Huang, “A Message to Our Company,” Nov 8, 2026. nvidianews.nvidia.com
- NVIDIA, “Statement from the Independent Members of the NVIDIA Board,” Nov 10, 2026. investor.nvidia.com
- The New York Times, “Nvidia Chief Seen as Target of Chinese Spy Plot,” Oct 29, 2026. nytimes.com
- TechCrunch, “Nvidia CEO Jensen Huang’s affair with alleged Chinese spy: a timeline,” Nov 12, 2026 (summarizes the Times and Journal reports). techcrunch.com
- Ministry of Foreign Affairs of the People’s Republic of China, regular press conference, Nov 9, 2026. mfa.gov.cn
- Kistenmacher v. NVIDIA Corp., No. 5:26-cv-13448 (N.D. Cal., filed Nov 9, 2026), class action complaint. dandodiary.com
- Sharpe, “Capital Asset Prices: A Theory of Market Equilibrium under Conditions of Risk,” Journal of Finance, 1964. doi.org
- Ang, Hodrick, Xing & Zhang, “The Cross-Section of Volatility and Expected Returns,” Journal of Finance, 2006. doi.org
- Ang, Hodrick, Xing & Zhang, “High Idiosyncratic Volatility and Low Returns: International and Further U.S. Evidence,” Journal of Financial Economics, 2009. doi.org
- Bali & Cakici, “Idiosyncratic Volatility and the Cross Section of Expected Returns,” Journal of Financial and Quantitative Analysis, 2008. doi.org
- Fu, “Idiosyncratic Risk and the Cross-Section of Expected Stock Returns,” Journal of Financial Economics, 2009. doi.org
- Hou & Loh, “Have We Solved the Idiosyncratic Volatility Puzzle?” Journal of Financial Economics, 2016. doi.org
- Bali, Cakici & Whitelaw, “Maxing Out: Stocks as Lotteries and the Cross-Section of Expected Returns,” Journal of Financial Economics, 2011. doi.org
- Merton, “A Simple Model of Capital Market Equilibrium with Incomplete Information,” Journal of Finance, 1987. doi.org
- Hendrik Bessembinder, wealth creation and returns data, 1926-2025 (spreadsheet posted March 2026). wpcarey.asu.edu
- Bessembinder, “Do Stocks Outperform Treasury Bills?” Journal of Financial Economics, 2018. doi.org
- State Street Global Advisors, Technology Select Sector SPDR Fund (XLK), holdings as of Nov 11, 2026. ssga.com
- RBC Wealth Management, “The great narrowing: S&P 500 concentration,” Jan 22, 2026 (FactSet data). rbcwealthmanagement.com
- CNBC, “IBM hasn’t been this unimportant to the market in at least 40 years,” Jan 22, 2018 (S&P Dow Jones Indices data). cnbc.com
- Gabaix, “The Granular Origins of Aggregate Fluctuations,” Econometrica, 2011. doi.org
- NVIDIA Corporation, Form 10-K for the fiscal year ended Jan 25, 2026, Risk Factors. sec.gov
- Johnson, Magee, Nagarajan & Newman, “An Analysis of the Stock Price Reaction to Sudden Executive Deaths,” Journal of Accounting and Economics, 1985. doi.org
- Salas, “Entrenchment, Governance, and the Stock Price Reaction to Sudden Executive Deaths,” Journal of Banking & Finance, 2010. doi.org
- Nguyen & Nielsen, “What Death Can Tell: Are Executives Paid for Their Contributions to Firm Value?” Management Science, 2014. doi.org
- Cline, Walkling & Yore, “The Consequences of Managerial Indiscretions: Sex, Lies, and Firm Value,” Journal of Financial Economics, 2018. doi.org
- Bennedsen, Pérez-González & Wolfenzon, “Do CEOs Matter? Evidence from Hospitalization Events,” Journal of Finance, 2020. doi.org
- Fahlenbrach, “Founder-CEOs, Investment Decisions, and Stock Market Performance,” Journal of Financial and Quantitative Analysis, 2009. doi.org
- Meulbroek, “Company Stock in Pension Plans: How Costly Is It?” Journal of Law and Economics, 2005. doi.org
- Statman, “How Many Stocks Make a Diversified Portfolio?” Journal of Financial and Quantitative Analysis, 1987. doi.org
- Domian, Louton & Racine, “Diversification in Portfolios of Individual Stocks: 100 Stocks Are Not Enough,” Financial Review, 2007. doi.org
- Markowitz, “Portfolio Selection,” Journal of Finance, 1952. doi.org
Method
Event study: daily dividend-adjusted closes from Yahoo Finance; market models estimated by OLS over the 250 trading days ending Oct 27, 2026; t-statistics divide the cumulative abnormal return by the residual standard deviation times the square root of the window length. Risk shares: weekly (Friday) returns, Oct 27, 2023 to Oct 23, 2026, with Nvidia regressed on the iShares MSCI ACWI ETF, and on ACWI and SOXX together; shares assume Nvidia’s residual is uncorrelated with the rest of each fund. Fund weights come from issuer holdings files. Index contributions use Nvidia’s SPY weight backed out daily from the Nov 11 file by relative price. The script and derived data are in summitward-research.
More in Investing & Portfolio
Browse all investing & portfolio guidesGet new guides by email
Evidence-based, no jargon. At most two emails a month. Unsubscribe any time.
Try it in Summitward
See portfolio factor analysis in action with your own financial data. Free to start, no credit card required.