

VOO and SCHD Overlap by 8%: What That Number Measures and What It Misses
On Oct 13, 2026 holdings, VOO and SCHD overlapped 7.7% by weight, yet 95% of SCHD sat in S&P 500 stocks. What overlap measures, and what correlation shows.
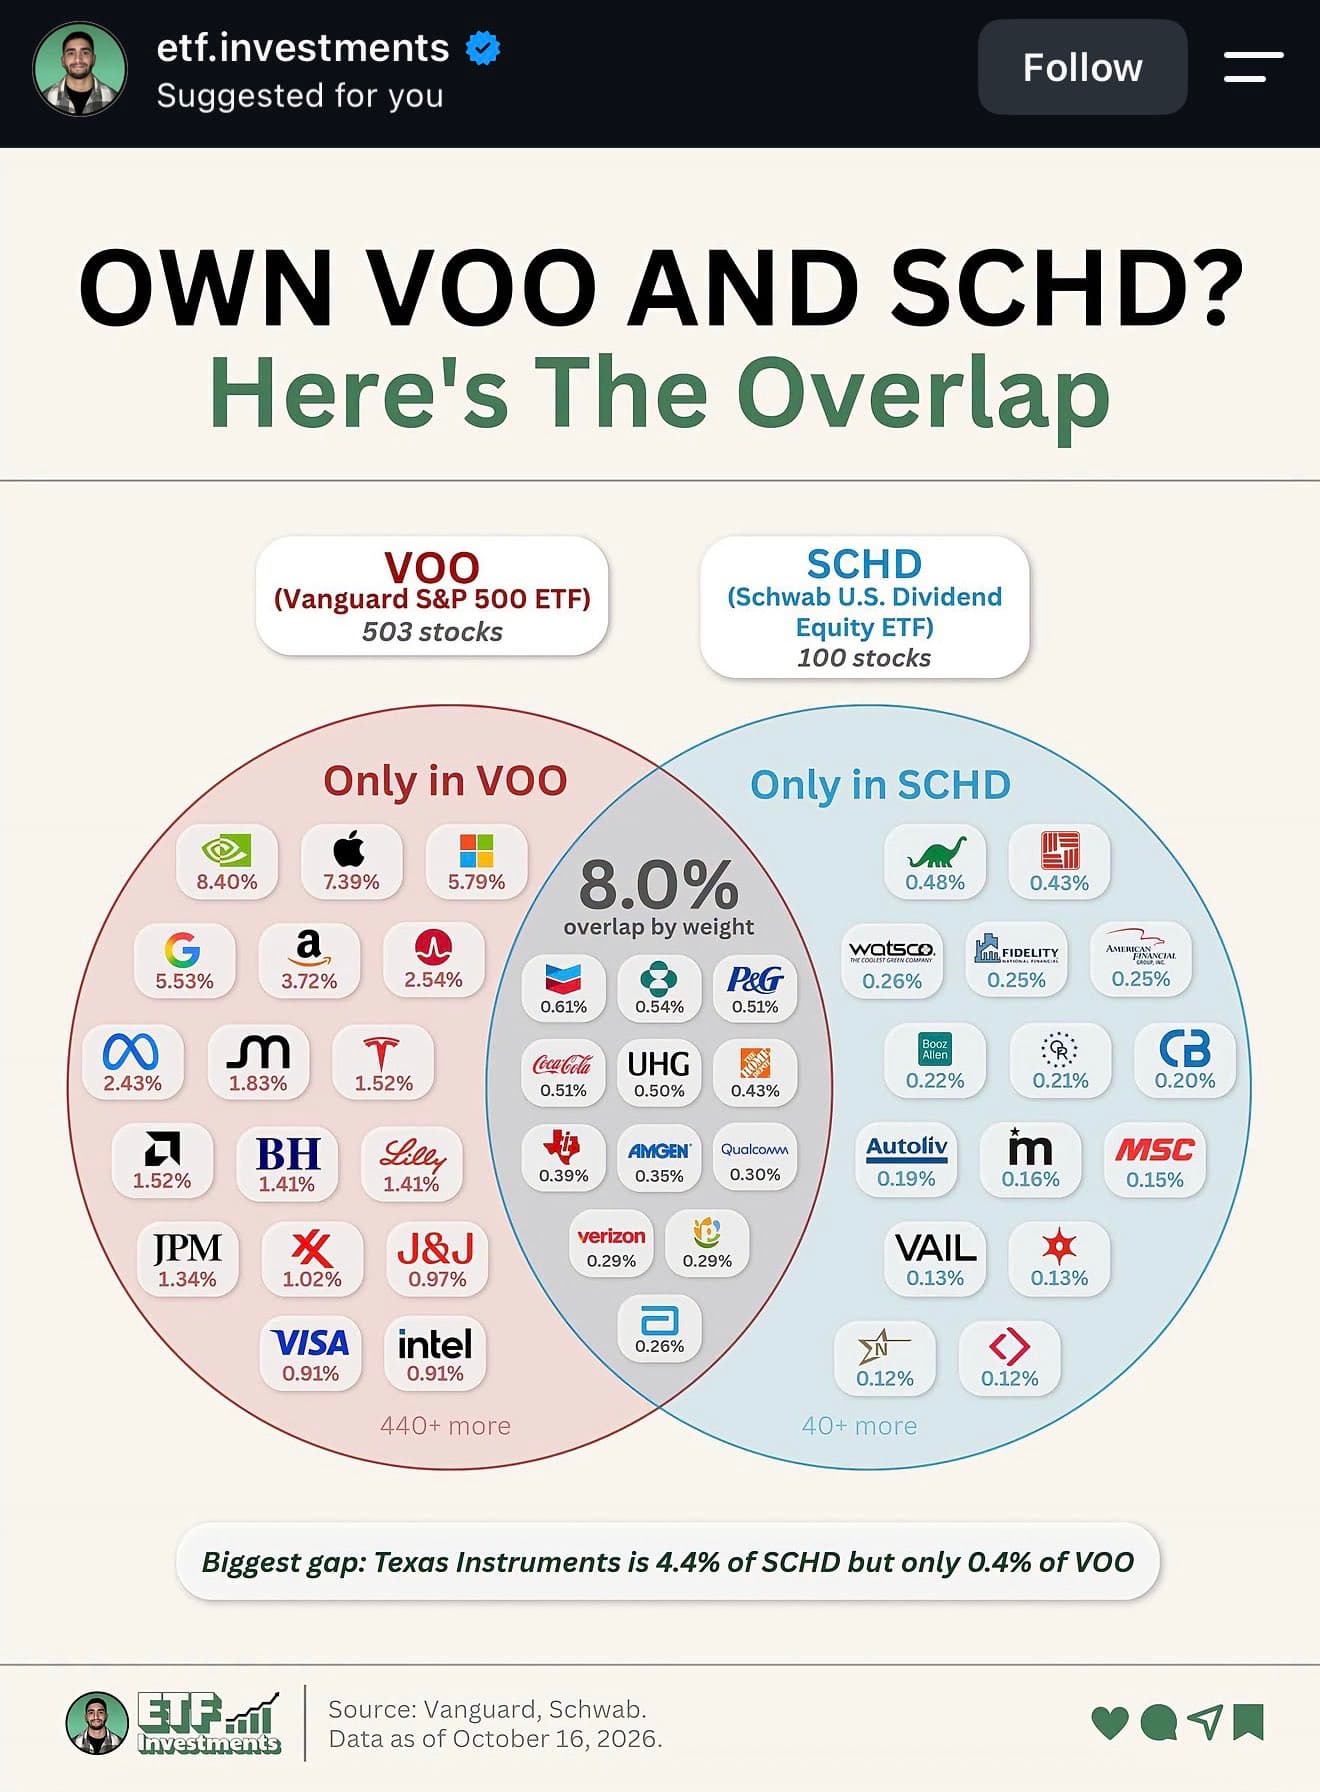
Source: @etf.investments on Instagram, October 22, 2026. The graphic says its data is as of October 16; its VOO weights match Vanguard’s September 30 month-end holdings.
This graphic has been making the rounds, and its number is correct. Measured the standard way, VOO and SCHD overlapped by 7.7% of their weight on October 13, 2026, close to the 8% it shows. The question readers keep asking is what that 8% tells you. If you own VOO, does adding SCHD give you a portfolio that is 92% different?
The short version
The 8% measures how much of the two portfolios sits in the same stocks at the same weights. It does not measure how much the funds move together, which is what diversification is about. On the same October 13, 2026 holdings, 95% of SCHD’s money was in S&P 500 companies that VOO also owns. Of three funds I tested with zero overlap with VOO, monthly correlations ranged from 0.36 to 0.90, and the S&P MidCap 400 fund, which shares no stocks with VOO, tracked it more closely from 2011 to 2026 than SCHD did. SCHD is still a genuinely different ride: it trailed VOO by 22 points in 2023 and led it by 19 points through October 23, 2026. To judge it, look at correlation, tracking error, and factor loadings, and leave the overlap figure out of it.
How the 8% is calculated
Overlap tools take every stock both funds hold, keep the smaller of the two weights, and add those up.1 With and as the weight of stock in each fund:
The second form is one minus Active Share, the measure Cremers and Petajisto built to describe how far a fund manager strays from a benchmark.2 The two are the same number seen from opposite sides, so an 8% overlap means SCHD has 92% Active Share against VOO. The identity holds for long-only funds whose weights each sum to one. Active Share measures how different the holdings are. It was never meant as a measure of risk, and later work found it says little about future returns once you compare funds against the same benchmark.3
Texas Instruments shows how the formula behaves. On October 13 it was 4.71% of SCHD and 0.39% of VOO. The overlap counts 0.39%. The other 4.32 points of SCHD’s Texas Instruments position are money invested in a company VOO owns, and they count for nothing.
A two-stock example makes the point starker. Fund A holds 90% of stock X and 10% of stock Y. Fund B holds 10% of X and 90% of Y. They own exactly the same companies, and their overlap is 20%: the smaller weight of X (10%) plus the smaller weight of Y (10%).
The infographic is easier to read with that in mind. The percentages in the middle are VOO’s weights, the smaller side of every shared stock. Chevron shows as 0.61% because that was its weight in VOO; in SCHD it is over 4%. The SCHD-only names on the right are small positions, mostly under half a percent each.
Three numbers from the same two holdings files
I matched Schwab’s full SCHD holdings for October 13, 2026 against the S&P 500 on the same day.45 The same two files give three answers to “how much do these funds overlap?”, depending on the question you ask.
| Question | Answer |
|---|---|
| How much weight do the funds hold in common? | 7.7% |
| How many of SCHD’s 98 stocks are in the S&P 500? | 45 (46%) |
| How much of SCHD’s money is in S&P 500 stocks? | 95.0% |
Split SCHD’s portfolio three ways and all three numbers fit. 7.7% of it matches VOO weight for weight. Another 87.3% is extra weight in those same 45 companies, above what VOO holds. The last 5.0% is spread across 53 smaller companies outside the S&P 500, such as HF Sinclair, East West Bancorp, and Watsco.
In all 45 shared stocks, SCHD holds more than VOO does. So the overlap figure reduces to something simpler: 7.7% of VOO is invested in SCHD’s 45 S&P 500 stocks. Read that way, the low number says VOO is mostly made of companies SCHD skips, starting with Nvidia, Apple, Microsoft, Alphabet, and Amazon. It says very little about whether SCHD is different from VOO; 95% of SCHD lives inside VOO.
The figure also moves. Repricing the same holdings to October 22, after SCHD rose 6.1% while VOO fell 1.8%, gives 8.3%. Overlap is a snapshot of weights, and weights change every day prices do.
Overlap and correlation rank funds differently
Diversification is about co-movement. Markowitz’s point in 1952 was that a portfolio’s risk depends on how its holdings move together, which you cannot read off the holdings list.6 The direct test is to set overlap beside correlation for funds whose relationship to VOO is known.
| Fund | Overlap with VOO | Correlation, monthly | Correlation, daily | Tracking error vs VOO |
|---|---|---|---|---|
| IVV (S&P 500) | ~100% | 1.00 | 1.00 | 0.3% |
| RSP (equal-weight S&P 500) | 43.5% | 0.94 | 0.95 | 5.2% |
| IJH (S&P MidCap 400) | 0% | 0.90 | 0.91 | 7.4% |
| SCHD | 7.7% | 0.84 | 0.88 | 7.7% |
| VXUS (international stocks) | 0% | 0.83 | 0.85 | 8.4% |
| BND (U.S. bonds) | 0% | 0.36 | 0.08 | 13.0% |
Monthly figures: November 2011 to September 2026, 179 months. Daily: October 21, 2011 to October 23, 2026. Tracking error is the annualized standard deviation of the monthly return difference. Foreign markets close hours before New York, which pulls VXUS’s daily correlation down, so the monthly column is the better comparison. Source: Summitward calculation from Yahoo Finance total-return prices.7
Three funds share nothing with VOO, and their correlations run from 0.36 to 0.90. Overlap gives all three the same score. The S&P 400 and S&P 500 do not share companies (IJH’s 400 stocks on October 23, 2026 included none from the S&P 500), yet over these fifteen years IJH tracked VOO more closely than SCHD did, by both correlation and tracking error. And RSP holds every VOO stock at a different weight, so its overlap is 43.5%, yet it is the second-closest fund on the list.
Overlap is good at one thing: telling you when two funds are the same portfolio. VOO and IVV overlap almost completely and move in lockstep. Below that, the number stops tracking risk.
How differently SCHD has actually behaved
A monthly correlation of 0.84 with VOO is high, and SCHD still produced very different calendar years.
| Year | VOO | SCHD | Gap |
|---|---|---|---|
| 2016 | 12.2% | 16.4% | +4.2 |
| 2017 | 21.8% | 20.8% | −1.0 |
| 2018 | −4.5% | −5.6% | −1.1 |
| 2019 | 31.4% | 27.3% | −4.1 |
| 2020 | 18.3% | 15.0% | −3.3 |
| 2021 | 28.8% | 29.9% | +1.1 |
| 2022 | −18.2% | −3.3% | +14.9 |
| 2023 | 26.3% | 4.5% | −21.8 |
| 2024 | 25.0% | 11.7% | −13.3 |
| 2025 | 17.8% | 4.3% | −13.5 |
| 2026 to Oct 23 | 12.4% | 31.7% | +19.3 |
Total returns with dividends reinvested, from Yahoo Finance adjusted prices. Gap is SCHD minus VOO in percentage points. From 2012 through 2025 the average absolute gap was 6.2 points a year.
From October 20, 2011, SCHD’s first day of trading, to October 23, 2026, VOO returned 15.0% a year and SCHD 13.6%. That gap is history, not a forecast, and it says nothing about what the next fifteen years hold. What the table does show is that the two funds diverge by large amounts in individual years, in both directions.
The relationship has also changed. The daily correlation between the two was between 0.92 and 0.97 in most years from 2012 to 2022. It fell to 0.60 in 2024, 0.73 in 2025, and 0.20 so far in 2026. On a rolling 36-month basis it peaked at 0.98 in the window ending April 2020 and sat at 0.50 in the window ending September 2026, the lowest reading in the fund’s history. The equal-weight S&P 500 also drifted away from VOO in 2026 (0.75, its lowest yearly figure in the sample), so the cap-weighted index’s path this year has differed from the typical stock’s, and SCHD’s sector mix put it far from that path.
A 0.20 correlation over ten months is a real measurement of how the two funds behaved in 2026. It is a poor estimate of how they will behave in the next crash, which is the subject of the section after next.
What SCHD’s dividend screen changes
SCHD tracks the Dow Jones U.S. Dividend 100 Index, which requires ten consecutive years of dividends and ranks companies on cash flow to debt, return on equity, dividend yield, and dividend growth (details in Why I Avoid SCHD). The screen reshapes the sector mix. Using the S&P 500’s own sector labels for the 95% of SCHD inside it:
| Sector | VOO | SCHD (S&P 500 holdings only) |
|---|---|---|
| Information technology | 39.3% | 12.4% |
| Consumer staples | 4.6% | 20.0% |
| Health care | 9.1% | 18.5% |
| Energy | 3.6% | 15.7% |
| Industrials | 8.0% | 10.5% |
| Financials | 11.5% | 6.3% |
| Communication services | 9.9% | 5.5% |
| Consumer discretionary | 8.7% | 6.1% |
Weights as of October 13, 2026, as a share of each fund. SCHD’s column sums to 95% because its 53 holdings outside the S&P 500 are not classified here. VOO weights from IVV holdings repriced to October 13. Sector labels are iShares’ GICS assignments.
The sector weights also move from year to year. SCHD rebuilds its list every March, and Schwab lists its portfolio turnover at 40.61% as of September 30, 2026.4
A factor regression puts the same difference in standard terms. I regressed both funds’ monthly returns on the Fama-French five factors from November 2011 to August 2026.8
| Loading | VOO | SCHD |
|---|---|---|
| Market | 0.99 | 0.83 (t 26.9) |
| Size (SMB) | −0.12 | 0.07 (t 1.3) |
| Value (HML) | 0.02 | 0.20 (t 2.8) |
| Profitability (RMW) | 0.05 | 0.33 (t 6.3) |
| Investment (CMA) | 0.03 | 0.30 (t 3.6) |
| R² | 0.996 | 0.852 |
Monthly excess returns, 178 months. t-statistics use Newey-West standard errors with six lags. Factors from Kenneth French’s data library (file built from the August 2026 CRSP database).
SCHD carries meaningful tilts toward profitable companies, conservative investors, and value, with less market exposure per dollar. Those loadings match the ones in our dividend fund regressions to within 0.01. Regressed on VOO alone, SCHD has a beta of 0.83 and an R² of 0.72, so about 28% of the variation in its monthly returns is not explained by VOO. A low overlap figure is consistent with that. It does not measure it.
When stocks fall together
Diversification matters most in a sell-off, and correlations between stock portfolios tend to rise in down markets. Longin and Solnik found this across international markets, and Ang and Chen found that U.S. stock portfolios are much more correlated with the market on the way down than on the way up.910 SCHD’s record fits that pattern in one crash and departs from it in another.
- 2020: VOO’s deepest fall was 34.0%, and SCHD’s was 33.4%. Daily correlation that year was 0.95.
- 2022: VOO fell as much as 24.5% and SCHD 16.8%. SCHD finished the year down 3.3% against VOO’s 18.2%.
- All down months: VOO lost money in 55 of the 179 months. SCHD lost money in 48 of those 55, falling 2.8% on average when VOO fell 3.4%, so it captured about 84% of VOO’s down months and 86% of its up months.
That is the profile of a lower-beta stock fund. It cushioned some declines and none of them reliably, and it went down with the market most of the time. In the fastest crash of the period, the different holdings made almost no difference.
How much a SCHD sleeve changes a VOO portfolio
Here is what happened to a VOO portfolio with part of it moved to SCHD, using the November 2011 to September 2026 monthly returns, rebalanced each month:
| SCHD share | Volatility | Tracking error vs VOO | Annual return | Effective number of stocks |
|---|---|---|---|---|
| 0% | 13.9% | 0.0% | 14.9% | 41 |
| 10% | 13.7% | 0.8% | 14.7% | 48 |
| 20% | 13.5% | 1.5% | 14.6% | 56 |
| 30% | 13.3% | 2.3% | 14.4% | 63 |
| 50% | 13.2% | 3.9% | 14.0% | 67 |
| 100% | 13.6% | 7.7% | 13.0% | 34 |
Volatility and return from monthly total returns, November 2011 to September 2026, rebalanced monthly; past returns, not expected ones. Effective number of stocks is 1 divided by the sum of squared stock weights, from October 13, 2026 holdings with share classes combined.
By the holdings measure, the change is large. Cap weighting makes VOO’s weights as concentrated as an equal-weighted portfolio of about 41 stocks. A 20% SCHD sleeve raises that to 56 and cuts the top ten stocks from 40.7% of the portfolio to 32.7%. By the return measure, the change is small: volatility fell from 13.9% to 13.5%, and the cost of that history was a third of a point of return a year. Both are true, and they answer different questions. Concentration in a few companies is a real risk, and SCHD reduces it. Market risk is the larger one, and SCHD leaves most of it in place.
The calculator below starts at those historical inputs, with expected returns set equal so it shows only the risk effect. Slide the correlation from 0.85 to 0.20 to see what 2026’s correlation would do if it persisted, and to see how much the answer depends on the period you measure.
What overlap is good for
The statistic has real uses. It flags funds that duplicate each other, such as VOO and IVV, or a target-date fund and the index fund inside it. And the stock-level weights behind it tell you how much of any one company you own across funds. At 80% VOO and 20% SCHD, Chevron becomes your eighth-largest holding at 1.4%, about twice its weight in VOO. That is worth knowing if you also hold Chevron through an employer plan or a brokerage account.
For the diversification question, use measures built for it:
- Correlation over several windows and frequencies, including a period with a crash in it.
- Tracking error, which tells you how far apart the two funds’ returns typically land in a year. For SCHD against VOO it is about 7.7 points.
- Beta and R² against what you already own.
- Factor loadings, which name the exposures a fund adds: here, value, profitability, and conservative investment.
- Look-through stock and sector weights, which show concentration across all your funds combined.
The Modern Portfolio Theory guide covers why the first three matter, and Choueifaty and Coignard’s diversification ratio is one way to roll them into a single figure.11 For the 80/20 mix above it is 1.03, meaning portfolio volatility was about 2.5% below the weighted average of the two funds’ volatilities.
See how your own funds move together
Summitward's portfolio analysis shows correlations between your funds, factor exposures, and position concentration across your real holdings, so you can check whether a second fund adds an exposure or repeats one.
Analyze my portfolioWhat I recommend
Leave the overlap figure out of the decision. If you own VOO and are considering SCHD, the question is whether you want a sustained tilt toward profitable, conservatively run, value-priced U.S. companies, and whether you will hold it through a year like 2023, when it trailed by 22 points. If yes, SCHD is a cheap and transparent way to get that tilt, and it does reduce single-stock concentration. If you hold it in a taxable account, its 3.24% trailing distribution yield (as of September 30, 2026) is taxed every year, which is the main reason I make the same tilt with other funds; the SCHD tax drag calculator puts a dollar figure on that.
If the goal is a less volatile portfolio, SCHD is a weak lever. Over the same months, a 20% SCHD sleeve took volatility from 13.9% to 13.5%, while a 20% sleeve of BND, a total bond market fund, took it to 11.5%. Another stock fund does not do much better: a 20% VXUS sleeve landed at 13.6%. The reason to own international stocks is exposure to other economies and currencies, which SCHD does not provide. The case for global diversification and bonds as a diversifier cover those choices.
Frequently asked questions
How much do VOO and SCHD overlap?
By weight, 7.7% on October 13, 2026 holdings, and 8.3% at October 22 prices. By count, 45 of SCHD’s 98 stocks are in the S&P 500. By SCHD’s dollars, 95.0% is in S&P 500 companies. All three come from the same holdings; they answer different questions.
Is 8% overlap good for diversification?
It tells you little either way. Three funds with 0% overlap with VOO ranged from 0.36 to 0.90 in monthly correlation from 2011 to 2026. SCHD, at 8%, had a 0.84 correlation with VOO over the same months, lower than the S&P MidCap 400 fund at 0%.
Should I own both VOO and SCHD?
Own both if you want a lasting tilt toward profitable, value-priced dividend payers and can accept years of large underperformance. Skip it if your goal is lower risk, since a 20% sleeve barely changed volatility from 2011 to 2026, or if the dividends would be taxed in a taxable account and you can get the tilt another way.
What overlap percentage is too much?
Near 100%, two funds are the same portfolio and one of them is clutter. Below that there is no threshold that maps to risk, because overlap does not measure co-movement. Check correlation and tracking error instead.
Why has SCHD moved so differently from VOO in 2026?
Its daily correlation with VOO was 0.20 from January 1 to October 23, 2026, after 0.92 to 0.97 in most years through 2022. SCHD holds about 12% in technology against VOO’s 39%, and in 2026 the cap-weighted index has moved apart from the typical stock; even the equal-weight S&P 500’s correlation with VOO fell to 0.75. One unusual year is weak evidence about the next one, and in the 2020 crash the two funds fell almost exactly together.
Does SCHD hold stocks VOO does not?
Yes, 53 of them on October 13, 2026, all smaller U.S. companies outside the S&P 500, together 5.0% of SCHD. Most of SCHD by weight is in the large dividend payers VOO already owns.
Key takeaways
- The 8% is accurate and narrow. It is the weight two funds hold in common, equal to one minus Active Share, and it was 7.7% on October 13, 2026 holdings.
- 95% of SCHD is in S&P 500 companies. The overlap is low because SCHD holds the same companies at much higher weights and skips VOO’s largest ones.
- Overlap does not rank funds by risk. From 2011 to 2026, three zero-overlap funds ranged from 0.36 to 0.90 in monthly correlation with VOO, and the S&P 400 fund tracked VOO more closely than SCHD.
- SCHD is a real style tilt. It has loaded on value, profitability, and conservative investment, with 7.7% annual tracking error and calendar gaps of up to 22 points.
- It barely reduced portfolio volatility. In the 2011 to 2026 data a 20% sleeve moved volatility from 13.9% to 13.5%, and SCHD fell as far as VOO in the 2020 crash.
Related guides
- VOO vs SCHD puts fees, returns, and taxes for the two funds side by side.
- Why I Avoid SCHD for the index rules, the tax cost, and the funds I use instead.
- Dividend Growth vs. Small-Cap Value for factor regressions on SCHD, VIG, VYM, and small-value funds.
- Every Portfolio Is Long/Short for Active Share and what a fund is betting against its benchmark.
- VOO + QQQ + SCHD for the three-fund version of this question.
- Is VT the Most Diversified ETF? for why stock count and diversification come apart.
- Modern Portfolio Theory for Real Life for the covariance math behind all of this.
Sources and method
- StockAnalysis, Fund holdings overlap tool, tutorial. Describes overlap as the sum of the smaller weight in each shared holding. Their tool reported 7.7% for VOO and SCHD on October 23, 2026, using SCHD holdings from that date and VOO from September 30. Portfolio Terminal’s VOO vs SCHD comparison reported 7.6% and 95% of SCHD in VOO-held companies on September 30 data.
- K. J. Martijn Cremers and Antti Petajisto, “How Active Is Your Fund Manager? A New Measure That Predicts Performance,” Review of Financial Studies 22(9), 2009, 3329–3365. Defines Active Share as half the sum of absolute weight differences.
- Andrea Frazzini, Jacques Friedman, and Lukasz Pomorski, “Deactivating Active Share,” Financial Analysts Journal 72(2), 2016, 14–21. Finds Active Share does not predict returns within a benchmark.
- Schwab Asset Management, SCHD full holdings, as of October 13, 2026 (102 lines: 98 stocks, a money market fund, cash, and two futures contracts), and the SCHD fund page, read October 25, 2026: 0.06% expense ratio, 3.24% trailing distribution yield and 40.61% portfolio turnover as of September 30, 2026.
- iShares, IVV holdings file, as of October 22, 2026. IVV and VOO track the same S&P 500 index, so IVV stands in for VOO. Weights were repriced to October 13 as share quantity times that day’s closing price. A delisted Hologic stub priced at one cent was dropped.
- Harry Markowitz, “Portfolio Selection,” Journal of Finance 7(1), 1952, 77–91.
- Summitward calculation, voo-schd-overlap (Python). Total-return prices are Yahoo Finance adjusted closes, October 20, 2011 to October 23, 2026, which account for SCHD’s 3-for-1 split in October 2024. Monthly statistics use full calendar months; portfolio mixes rebalance monthly; overlap is matched by ticker with each fund’s stock weights summing to one.
- Eugene F. Fama and Kenneth R. French, “A Five-Factor Asset Pricing Model,” Journal of Financial Economics 116(1), 2015, 1–22. Factor returns from the Kenneth French Data Library.
- François Longin and Bruno Solnik, “Extreme Correlation of International Equity Markets,” Journal of Finance 56(2), 2001, 649–676.
- Andrew Ang and Joseph Chen, “Asymmetric Correlations of Equity Portfolios,” Journal of Financial Economics 63(3), 2002, 443–494.
- Yves Choueifaty and Yves Coignard, “Toward Maximum Diversification,” Journal of Portfolio Management 35(1), 2008, 40–51. The diversification ratio is the weighted average of holdings’ volatilities divided by portfolio volatility.
More in Investing & Portfolio
Browse all investing & portfolio guidesGet new guides by email
Evidence-based, no jargon. At most two emails a month. Unsubscribe any time.
Try it in Summitward
See portfolio factor analysis in action with your own financial data. Free to start, no credit card required.