Do Most S&P 500 Returns Really Come From Dividends?
Many investors hear that 75% of S&P 500 returns come from dividends. The real attribution is about 31% to 33%. What actually drives long-run stock wealth, with a calculator.
A chart makes the rounds every few months: one line for the S&P 500 with dividends reinvested, a much lower line for “dividends not reinvested,” and a caption claiming something like “75% of S&P 500 returns come from dividends.” The gap between the two lines is real. The interpretation usually pinned on it is wrong.
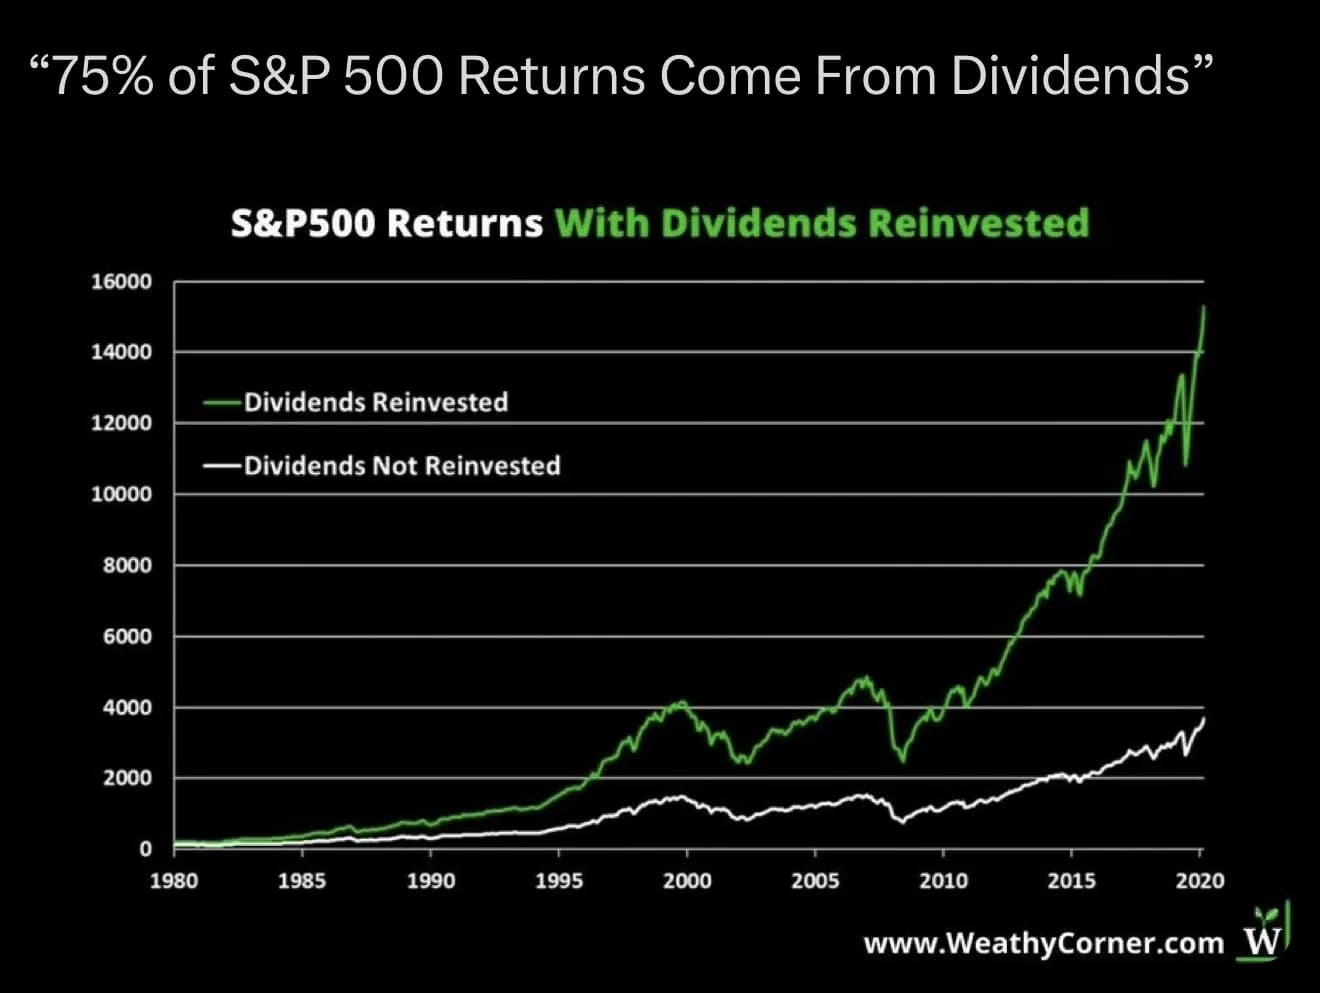
Source: chart circulated on social media, credited to WeathyCorner.com. It is the canonical version of the “most returns come from dividends” claim and the one this guide takes apart.
The short version
Reinvesting dividends has mattered enormously for long-run wealth. That is a fact about compounding, not evidence that dividends are the source of most stock returns. Measured properly, dividend income has contributed roughly 31% to 33% of the S&P 500’s total return over long windows, with the other two-thirds from price appreciation. The dramatic chart compares an investor who keeps every cash flow invested against one who pulls the dividend out each year. For someone building wealth, the practical lesson is to reinvest and stay diversified. Chasing yield is a separate decision, and usually a worse one.
Three returns that get blurred together
The confusion starts with three different things all called “return.” In a single year, with starting price , ending price , and dividends per share :
The total return is the price return plus the dividend yield, and a total-return index compounds that figure forward.3 A price index drops the dividend term entirely. So the honest reading of the viral chart is the first of these:
- Correct: ignore dividends completely and you understate how much wealth the stock market produced.
- Incorrect: therefore most stock returns come from dividends.
The second statement confuses a cumulative wealth gap with return attribution. Those are different questions with very different answers.
The compounding trap
Over sixty years, even a small annual dividend yield compounds into a huge dollar gap. But that gap is not just the dividends. It is the dividends plus every dollar of return those reinvested dividends went on to earn, year after year. It is a compounding effect on a reinvested cash flow.
When you instead ask what share of the annual total return came from dividend income, the number is far smaller. S&P Dow Jones Indices’ own research puts dividend income at about 31% of the monthly total return of the S&P 500 from 1926 through early 2025, with the remaining 69% from price appreciation.1 Hartford Funds, using a slightly different window, puts dividend income’s contribution at an average of 33% of total return from 1940 to 2025, and shows it swinging widely by decade.2 Dividends mattered most in low-return decades such as the 1940s and 1970s and least in the high-appreciation 1980s, 1990s, and 2010s.
So the supportable claim is that dividends have contributed about a third of total return, and that reinvesting them compounds that third into a large share of ending wealth. The claim that 75% of returns “come from” dividends does not survive the distinction between annual attribution and cumulative compounding.
The lower line is a spending plan in disguise
Here is the part the chart hides. The “dividends not reinvested” line is close to a price-only index, which means it describes an investor who receives the dividend and then removes that cash from the equity portfolio every single year. A more cynical, and useful, way to read the chart is this: if an investor pulls roughly the dividend yield out of stocks annually for decades, it should not surprise anyone that their ending wealth is far lower. That gap mostly measures the cost of pulling that cash out of the market.
Spending the dividend is economically close to selling that slice of the portfolio. The two are not identical: a dividend leaves automatically and the share price adjusts down by roughly the dividend amount on the ex-dividend date, whereas a sale is a choice you make. The ex-dividend mechanics are covered in detail here. From a total-wealth standpoint the effect is the same: cash that leaves the portfolio stops compounding.
The numbers people quote also lag reality. The S&P 500’s dividend yield is about 1.1% as of 2026, against a long-run average near 4.2%.4 The “2% dividend” that anchors a lot of these discussions is already well above what the index pays today. A modern S&P investor who reinvests is leaving a much smaller cash flow at work than the mid-century investors whose dividends drove those old decade-by-decade figures.
A dividend transfers value from the company to you
Under the dividend-irrelevance result of Miller and Modigliani, in a frictionless market and holding a firm’s investment policy fixed, whether the company packages cash as a dividend or retains it does not change the share’s value or the shareholder’s total return.5 Value comes from the earning power of the business, not from the act of receiving a dividend. Real markets add taxes, transaction costs, signaling, and behavior, so payout policy is not perfectly irrelevant. The core intuition holds: a dividend hands you cash the company already held on your behalf.
Behavioral research shows how easily this gets lost. Hartzmark and Solomon’s “Dividend Disconnect” finds that investors trade as if dividends and capital gains are separate, stable buckets, underappreciate that the price falls when the dividend is paid, and frequently do not reinvest at all. They call it the “free dividends fallacy.”6 Receiving a dividend feels different from selling shares, even though the wallet outcome is the same.
Run the decomposition yourself
The calculator below uses real S&P 500 total returns and dividend yields back to 1928. Because price return plus dividend yield equals total return every year, the three lines reconcile exactly: reinvested, price-only, and dividends-spent. Watch two numbers move in opposite directions. The ending-wealth ratio gets dramatic over long windows, while the dividend share of the annual return stays near a third. That contrast is the whole point.
Reinvested vs. spent: decompose the chart yourself
Real S&P 500 total returns and dividend yields, 1928–2025 (Damodaran). The price-only and reinvested lines reconcile exactly: price return plus dividend yield equals total return every year.
Ending wealth ratio
6.3×
Reinvested $7.19M vs. price-only $1.14M over 66 years. The chart that launches the “75% from dividends” claim.
Dividend share of annual return
29%
Dividends added 3.04%/yr of the 10.48% total return. The big ratio is compounding on reinvested dividends, not dividends as the source of most return.
$10K from 1960 to 2025
Annualized total return
10.48%
Price 7.44% + dividends 3.04%.
Dividends spent, ending wealth
$1.36M
Equity tracks price only; dividends pulled out as cash. This is the real “not reinvested” case.
Total dividends received
$220K
Cash thrown off by the price-only holding over the window.
Real annual data: S&P 500 total returns and dividend yields from Aswath Damodaran (1928–2025); cash uses historical 3-month T-bill returns. Annual granularity, so figures differ slightly from daily-reinvestment indices. The taxable case applies a flat 15% qualified-dividend rate and ignores state tax, the 3.8% NIIT, and capital-gains tax on sale. Educational tool, not advice or a forecast.
Set it to 1960 through 2024 and you get a reinvested-versus-price-only ratio above six, with dividends contributing roughly 30% of the annualized return. The same data produces both facts. One is a statement about compounding; the other is the actual attribution.
Hartford’s chart, read carefully
Hartford Funds publishes a frequently cited version of this argument. Its current edition shows $10,000 invested in the S&P 500 in 1960 growing to about $6.42 million with dividends reinvested versus about $982,000 on price alone through 2024, and states that 85% of the cumulative total return since 1960 is attributable to reinvested dividends and the power of compounding.2 Every piece of that is accurate. Three cautions keep it from being oversold:
- The 85% is a cumulative wealth-gap figure after decades of compounding, not an annual return attribution. The same report’s annual attribution averages 33%.
- The “price-only” comparison line is not literally “an investor who did not reinvest.” A real non-reinvestor might have spent the cash, held bonds, or bought a different stock. A price index simply omits the dividend.
- Hartford’s own decade chart undercuts the sensational reading: dividends drove most of the return in weak-price decades and a small slice in strong ones.
Hartford is right that reinvestment has been powerful. The popular screenshot of its chart is where the math gets sloppy.
Dividends are one payout channel among several
A modern dividend-only lens also misses how companies actually return cash. Fama and French documented the share of U.S. public firms paying dividends falling from 66.5% in 1978 to 20.8% in 1999 as firms changed and as payout shifted toward repurchases.7 Skinner later showed repurchases growing into a primary payout method, with dividend-only payers becoming rare,8 and the Brav, Graham, Harvey, and Michaely survey found managers keep dividends sticky and treat buybacks as the flexible residual after investment and liquidity needs.9
The scale is large. S&P 500 companies repurchased $249.0 billion of stock in the third quarter of 2025 and a record $1.02 trillion over the trailing twelve months, against $168.1 billion of dividends in the quarter.10 Buybacks return cash by shrinking the share count, which lifts price return rather than dividend yield. Judge total payout, and a dividends-only story understates how much cash the index actually returns to owners. The shareholder-yield guide works through net payout in depth.
Do dividend stocks beat the market?
Sometimes, and usually for reasons other than the dividend. Dividend growers and initiators have historically posted solid risk-adjusted returns, but dividend growth tends to proxy for profitability, quality, maturity, and balance-sheet strength. Those are documented return factors; the dividend is a correlated characteristic, not an independent source of return. Dividend yield can act as a value signal, though a narrow one, since the growing population of non-payers never shows up in a yield screen at all.7 AQR’s work on value argues for measuring it with a composite of metrics rather than any single ratio.14
High yield, specifically, is often a warning rather than a reward. A yield spikes when a price falls, and the market is frequently pricing in a dividend that is about to be cut. Reaching for the highest payers concentrates a portfolio in a few sectors and in companies under stress.
What this means if you invest for yourself
For investors still building wealth, the default is total-return investing in diversified low-cost funds, with dividends reinvested automatically. Reinvestment is where the compounding the chart celebrates actually comes from. Letting a yield target drive your asset allocation is the error to avoid.
For retirees, a dividend-spending framework can make behavioral sense if receiving organic cash flow keeps you from selling in a panic. Treating a dividend yield as a safe withdrawal rate does not. A 4% yield is not a 4% safe withdrawal rate: dividend-paying stocks are still stocks, payouts get cut in recessions, and a high yield can flag distress. A total-return withdrawal plan that sells a small, controlled slice is more flexible and often more tax-efficient.
For taxable investors, a dividend preference can cost you. Ordinary dividends are taxed as ordinary income; qualified dividends get the lower long-term capital-gains rate.12 Either way the tax is due in the year the dividend is paid, whether or not you wanted the cash. Capital gains, by contrast, are generally taxed only when you sell, so a low-turnover, capital-appreciation approach defers tax on your schedule.13 Hold dividend-heavy positions in tax-advantaged accounts where the drag disappears.
For stock pickers, the deeper issue is concentration of returns. Bessembinder found that 57.4% of U.S. stocks failed to beat one-month Treasury bills over their lifetimes, and that the best-performing 4% of stocks accounted for all of the net wealth the market created above T-bills from 1926 to 2016.11 Trying to hand-pick income names runs straight into that math. Broad diversification is the way to make sure you own the few winners.
When a dividend tilt is reasonable
A dividend-growth tilt can fit specific situations:
- Retirees who value visible cash flow and understand it is not free income.
- Holdings inside tax-advantaged accounts, where dividend tax drag does not apply.
- Investors deliberately seeking value, quality, profitability, or lower-volatility exposure, using dividends as one proxy among several.
- Investors who are measurably calmer, and less likely to sell at a bottom, when they receive cash.
It fits poorly for:
- High-income investors chasing yield in a taxable account.
- Young accumulators who think dividends beat capital gains.
- Anyone treating dividend stocks as a bond substitute, or a 4% yield as a safe 4% withdrawal rate.
- Anyone concentrating in the highest-yield names without checking why the yield is high.
Frequently asked questions
Do 75% of S&P 500 returns really come from dividends?
No. Dividend income has contributed roughly 31% to 33% of the S&P 500’s total return over long windows, with price appreciation supplying the rest.1 The 75% and 85% figures describe the cumulative ending-wealth gap created by reinvesting and compounding dividends over many decades, which is a different measurement than the share of return that comes from dividends.
Should I reinvest my dividends?
While you are accumulating, yes. Reinvesting keeps every cash flow compounding, which is the mechanism behind the impressive long-run charts. In retirement you might instead spend dividends as part of a broader total-return withdrawal plan. In a taxable account, remember the dividend is taxed the year it is paid whether or not you reinvest it.
Are dividend stocks safer than the rest of the market?
Not inherently. Dividend payers are still stocks and fall in bear markets, and dividends get cut when earnings drop. Some dividend-grower strategies have shown lower volatility, but that traces to quality and profitability characteristics rather than to the dividend itself. A high yield can be a sign of distress rather than safety.
If dividends are only a third of returns, why do the charts look so extreme?
Because the chart measures cumulative wealth, not annual attribution. A third of the return, reinvested and compounded for fifty or sixty years, becomes a large majority of the final dollar value. The extreme gap is the signature of compounding on a reinvested cash flow, and it also reflects that the lower line removes the dividend from the portfolio every year.
Sources
- S&P Dow Jones Indices. S&P 500 Dividend Aristocrats: The Importance of Stable Dividend Income. Dividend income was about 31% of the monthly total return of the S&P 500 from 1926 to February 2025.
- Hartford Funds. The Power of Dividends: Past, Present, and Future. $10,000 invested in 1960 grew to about $6.42M reinvested vs ~$982K price-only through 2024; dividend contribution averaged 33% of total return, 1940–2025. Figures update annually.
- S&P Dow Jones Indices. Index Mathematics Methodology. Total-return indices reflect price change plus reinvested dividend income; price indices reflect price change only.
- multpl. S&P 500 Dividend Yield. Trailing yield about 1.1% in 2026 against a long-run average near 4.2%.
- Miller, M. H., & Modigliani, F. (1961). Dividend Policy, Growth, and the Valuation of Shares. Journal of Business, 34(4), 411–433.
- Hartzmark, S. M., & Solomon, D. H. (2019). The Dividend Disconnect. Journal of Finance, 74(5), 2153–2199.
- Fama, E. F., & French, K. R. (2001). Disappearing Dividends: Changing Firm Characteristics or Lower Propensity to Pay?. Journal of Financial Economics, 60(1), 3–43. Payers fell from 66.5% (1978) to 20.8% (1999).
- Skinner, D. J. (2008). The Evolving Relation between Earnings, Dividends, and Stock Repurchases. Journal of Financial Economics, 87(3), 582–609.
- Brav, A., Graham, J. R., Harvey, C. R., & Michaely, R. (2005). Payout Policy in the 21st Century. Journal of Financial Economics, 77(3), 483–527.
- S&P Dow Jones Indices (Silverblatt). S&P 500 Q3 2025 Buybacks. Q3 2025 buybacks $249.0B; trailing-twelve-month record $1.02T; Q3 dividends $168.1B.
- Bessembinder, H. (2018). Do Stocks Outperform Treasury Bills?. Journal of Financial Economics, 129(3), 440–457. 57.4% of stocks underperformed T-bills; the top ~4% drove all net wealth creation.
- Internal Revenue Service. Topic no. 404, Dividends. Ordinary vs qualified dividend taxation.
- Internal Revenue Service. Topic no. 409, Capital Gains and Losses. Long-term gains taxed on sale at preferential rates.
- Asness, C., Frazzini, A., Israel, R., & Moskowitz, T. (2015). Fact, Fiction, and Value Investing. Journal of Portfolio Management. Value is best measured with a composite of metrics rather than a single ratio.
Related guides
- Dividends Are Not Free Money works through the ex-dividend price drop and why a dividend is a value transfer.
- Shareholder Yield adds buybacks and net issuance to the dividend to measure total payout.
- VOO vs QQQ vs SCHD puts a popular dividend ETF in the context of building a portfolio.
- Lump Sum vs DCA is another case where staying invested, rather than timing, drives the result.
More in Investing & Portfolio
Browse all investing & portfolio guidesGet new guides by email
Evidence-based, no jargon. At most two emails a month. Unsubscribe any time.
Try it in Summitward
See historical backtesting in action with your own financial data. Free to start, no credit card required.