

What Wealthfront's 9.8% Return Actually Measures
Wealthfront reports 9.80% a year since 2012 at risk score 9. Its own ladder runs from 4.80% to 9.80%, so the advertised number is mostly a risk choice.
Wealthfront’s reported return is recalculated daily. Every Wealthfront figure below was read from its own pages on September 14, 2026, showing performance as of September 13, 2026, and will have moved since. The arithmetic does not depend on the exact decimal.
The question shows up on message boards in more or less this form: Wealthfront advertises about 9% a year since inception, so is the robot any good? It is a reasonable thing to ask, and the number is real. It reports what money in a particular portfolio did, after fees, over fourteen years.
The number still cannot answer the question, because a historical return is mostly a fact about an allocation and an era. To find out what the service is worth you have to ask what a portfolio at the same risk level, held as plain index funds, would have done over the same years, and then ask what the automation did for you that you would not have done for yourself.
What the 9.8% measures
Start with the disclosure, which is more precise than the headline. Wealthfront states that its reported returns1 “reflect actual pre-tax performance for client accounts invested in Wealthfront’s Classic Automated Investing Account, with a composite risk score of 9 (Ranges 0.5-10),” that the figure “compounds the daily returns of client accounts from the time they were initially funded,” and that it “is calculated net of advisory fees and expenses.”
Four things follow from that sentence, and each of them matters.
- It is risk score 9 on a scale that runs from 0.5 to 10. That is near the aggressive end of twenty available allocations.
- It is net of fees but before your taxes. The 0.25% advisory fee is already deducted. Your own tax bill is not.
- It is a composite of real client accounts, each compounded from its own funding date, rather than a single buy-and-hold track record. Two providers reporting the same number can mean quite different things.
- It is recomputed continuously. As of September 13, 2026, the reported one-year return was 18.32% and the ten-year 11.23%. Both will read differently next month, with nothing changed about the strategy.
Wealthfront’s own numbers at every risk score
The historical performance page has a control that lets you change the risk score and see what that portfolio returned. The full ladder answers the original question more directly than any outside analysis could, so we stepped through all twenty settings and recorded each one.
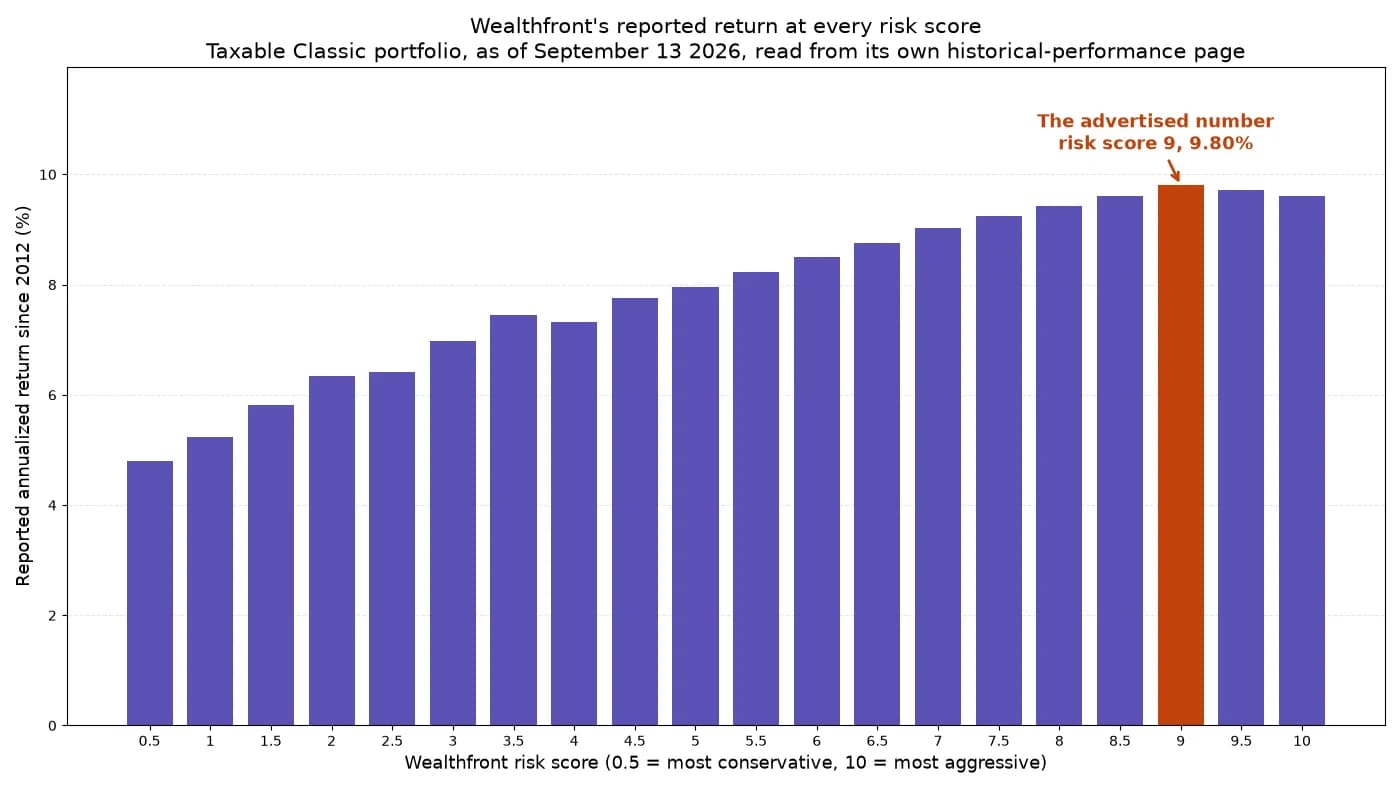
Wealthfront reported annualized return since inception, taxable Classic portfolio, read from its historical performance page on September 14, 2026, page as of September 13, 2026. Each value was re-read on a second slower pass and reproduced exactly. Data in data/wealthfront_risk_ladder.json, summary via scripts/analyze_robo_return_attribution.py.
The reported return climbs from 4.80% at risk score 0.5 to 9.80% at risk score 9. Five percentage points a year, from the same firm, the same software and the same period. The main thing that changed was the equity share, and with it the asset mix.
That is the answer to the message-board question. The 9.8% measures how much equity risk the client agreed to hold, in a stretch when equity risk paid well.
Two details in that ladder deserve a closer look. First, the advertised score sits at the top of it: risk score 9.5 reported 9.72% and risk score 10 reported 9.61%, so the number in the marketing is 0.08 and 0.19 points above the two more aggressive settings. Second, the ladder is not perfectly monotonic: risk 3.5 beat risk 4 as well. Both facts point the same way. These are composites of real accounts opened at different times, in portfolios whose asset mix changes along with the equity share, so gaps of a few tenths between adjacent scores are inside the noise and say nothing about which score was chosen for the headline.
Where the return came from
Wealthfront publishes an example allocation with ticker-level weights at one risk score, 8.0 of 10: 45% VTI, 18% VEA, 16% VWO, 12% LQD, 6% SCHP, and 3% VIG.2 That is 82% stocks and 18% bonds. We rebuilt exactly those weights out of index returns, rebalanced once a year, with no advisory fee and before fund expenses, and ran them over two thirteen-year stretches.
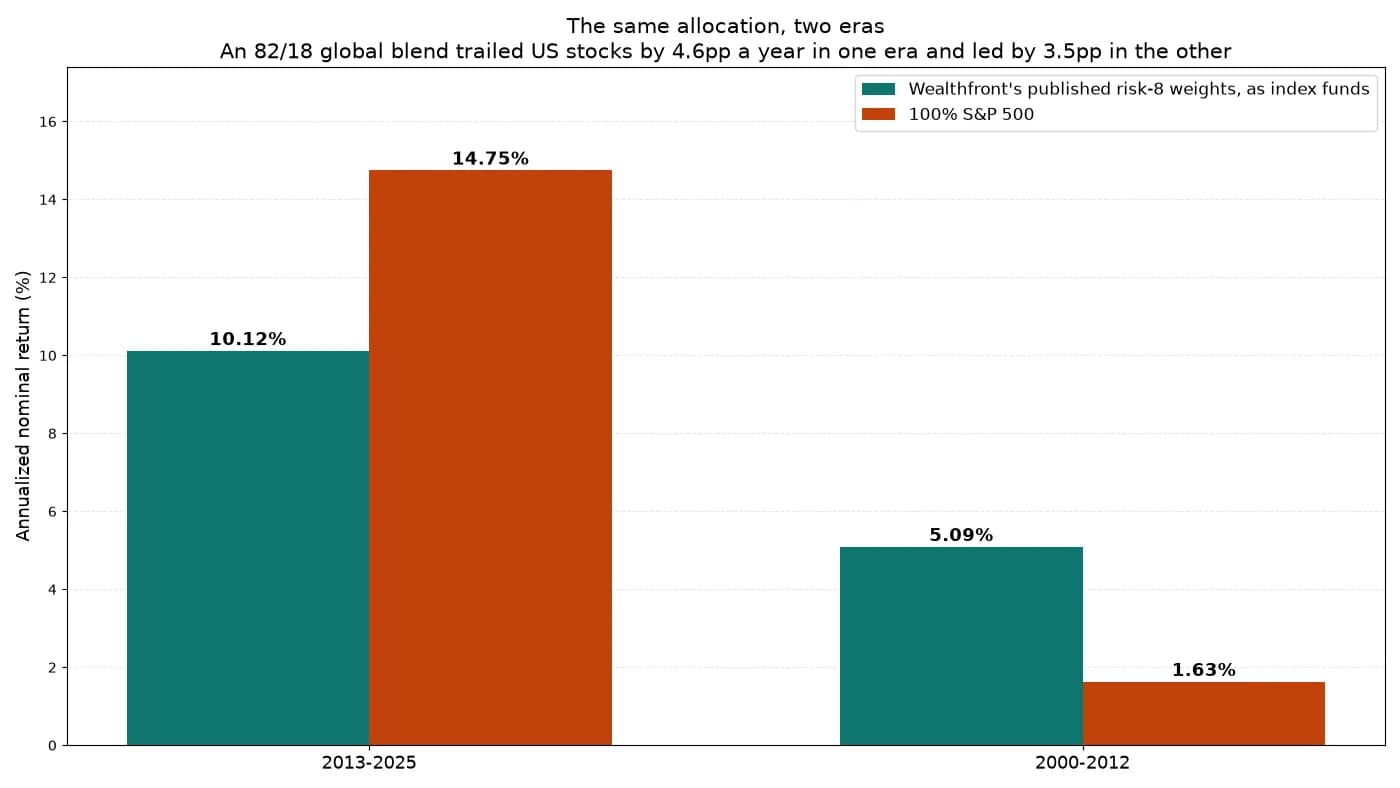
Wealthfront’s published risk-8 weights implemented with index returns, annually rebalanced, no advisory fee. Index proxies are approximate: S&P 500 for VTI, Baa corporates for LQD, 10-year Treasuries for SCHP. Nominal, whole calendar years, before tax. Reproduce with scripts/analyze_robo_return_attribution.py.
Over 2013 to 2025 that allocation returned 10.12% a year. On a weight-times-return basis, roughly 7 of the 10 points came from one line item, the US stock sleeve, which returned 14.75% a year on its own. The developed international sleeve contributed 1.4 points, emerging markets 0.9, corporate bonds 0.5, and Treasuries 0.05.
Set that beside the advertised 9.80%, with four differences in mind: the published weights are risk 8 and the headline is risk 9; the headline is net of fees and a composite of accounts funded on many dates, while the rebuild is a gross buy-and-hold figure; the windows overlap but do not match; and today’s weights are applied to years in which Wealthfront’s actual allocations differed. Add back the 0.25% fee and fund expenses to the 9.80% and the two land within a few tenths of a point of each other. A globally diversified portfolio at roughly this risk level returned roughly this much in this era, with or without a robo-advisor attached.
Now run the same weights over the thirteen years before, 2000 to 2012. The allocation returned 5.09% a year. The same portfolio, the same rules, half the return. And against a pure US stock portfolio the verdict flips completely: the blend trailed by 4.6 points a year in the first era and led by 3.5 points a year in the second. Roughly half of each gap is the 18% in bonds (2.1 points against, then 1.5 points for) and the rest is the international share of the stocks (2.6 against, then 2.0 for).
Neither result says anything about whether the diversification was wise. It was defensible in both. What the pair shows is that an advertised since-inception return is a statement about which years the product happened to exist for.
What a robo-advisor can take credit for
It helps to separate the sources of an investor’s outcome and ask, for each one, whether the service created it.
| Source of the outcome | Did the service create it? |
|---|---|
| Stocks and bonds went up | No. That is the market. |
| Holding more stocks than bonds | No. That is more risk, which you authorised. |
| Tilts toward value, small caps or a region | No. Those are factor exposures, and they cut both ways. |
| Cheap index funds instead of dear ones | Yes, measured against what you would otherwise have bought. |
| Automatic rebalancing | Yes, but as risk control. It is not a reliable return source. |
| Getting idle cash invested | Yes, and this one can be large. |
| Stopping you selling in a crash | Yes, when it happens, and it can dwarf the fee. |
| Tax-loss harvesting | Sometimes. Entirely dependent on your tax situation. |
| Not having to think about it | Yes. Real value, though not investment performance. |
| The advisory fee | Negative, unless the rows above beat it. |
The first three rows are where the 9.8% lives. The theory here is seventy years old and not controversial. Markowitz showed that risk is a property of the portfolio and that diversification helps only to the extent that assets move differently from one another.3 Choosing weights automatically does not make the underlying assets earn more.
Fama and French then showed that most of the variation in stock returns is explained by a few common exposures.4 The practical consequence for reading any performance claim is that “alpha” is only ever a residual against whichever benchmark you picked. A positive one is about as likely to mean you left a risk factor out of the comparison as it is to mean somebody was skilful.
What the research finds
The academic evidence on robo-advice is more favourable than a simple “do it yourself for free” argument would suggest, and more specific about who benefits.
One large study follows more than 55,000 previously self-directed investors who signed up for a hybrid advice service between 2015 and 2017.5 The portfolio changes were substantial: the share held in index funds went from 46% to 81%, international equity from 11% to 31%, average expense ratios from 23 basis points to 10, and money sitting in cash from 19% to 2%. Risk-adjusted performance improved by about 16%, and investors got back roughly six hours a year, which the authors value at around $450.
Two caveats travel with that result. The service studied is Vanguard Personal Advisor Services, a hybrid with human advisers and a 0.30% fee, so it is not evidence about any particular all-software product. And the Sharpe ratio improved because risk fell by about 16% and idiosyncratic risk by about 28%, while expected returns went slightly down. The result is better diversification at a slightly lower expected return.
A second study, of an Indian brokerage’s portfolio optimiser, makes the heterogeneity sharper.6 Investors who had held fewer than five stocks got meaningfully better diversification, lower volatility and better performance. Investors who already held more than ten got almost no diversification benefit, saw average returns that were “essentially flat,” and traded more afterwards. The tool reduced the disposition effect and trend chasing for everyone, though it did not eliminate either.
That is the shape of the thing. The benefit is large where there was a problem to fix and close to nil where there was not.
Advice versus automation
The most useful recent result separates being told what to do from having it done for you. In a pre-registered ten-week experiment with about 1,000 participants, one group traded alone, one received algorithmic recommendations, and one had the recommendations implemented by default with the right to override.7
The cleanest number in the study is the share of people who ended up with everything parked in a safe asset that lost real value every round. It was about 38% with no help, about 25% with advice, and 0.4% when the algorithm acted by default. Advice cut the mistake by roughly a third. Automation removed it.
The robos did not change whether people entered the market at all, though they did keep more of them in it. They helped the people already invested, which is the same pattern the Rossi and D’Acunto results show.
This is the case for paying a robo-advisor, and it has nothing to do with returns. Execution is the product. If a default gets your deposit invested on the day it lands, rebalances without asking you, and never once suggests that this time might be different, that is worth something, and for many people it is worth much more than 25 basis points.
The behavior gap, and a 2026 paper that shrank it
The usual evidence for that case is the gap between what funds return and what investors in them earn. Morningstar’s 2026 edition estimates that the average dollar in US funds and ETFs earned 8.7% a year over the decade to 2025 while the funds themselves returned 9.9%, a gap of about 1.2 percentage points.8
Morningstar is careful about what that measures, and the caution is its own, from the 2024 edition of the report: “even laudable practices like investing a portion of every paycheck or regularly rebalancing can open a gap between investor results and reported total returns,” so “it’s not advisable to view this study’s findings as a parable of ‘dumb money’.”
A 2026 paper in the Financial Analysts Journal goes further. Re-examining the sample behind Morningstar’s 2025 edition, the authors conclude that once cash flows are timed and measured differently (weighted at the start of each month rather than the end, on daily rather than monthly data, and with the effect of timing on past returns separated from its effect on future ones) the part attributable to poor timing is about 0.10% a year.9
The older evidence needs the same care. Barber and Odean’s study of 66,465 households is usually quoted as the heaviest traders earning 11.4% a year while the market returned 17.9%.10 Both figures are right, but they are not the same kind of number: 11.4% is net of costs and 17.9% is a gross index. The paper’s own matched comparison finds “very little difference in the gross performance of households that trade frequently and those that trade infrequently,” and the average household beat the index before costs, 18.7% against 17.9%, helped by tilts toward small and value stocks rather than by stock selection. The damage was commissions and spreads in the mid-1990s, when a retail trade cost far more than it does now.
So the behavioral case for automation survives, but in a narrower form. It rests on the dispersion rather than the average: gaps near zero in broad large-cap funds, and much wider ones in volatile sector, thematic and international products. If you own three index funds and never touch them, there is not much gap left for a robot to close.
Tax-loss harvesting: two numbers, two definitions
Tax management is the one place a robo can claim a return edge over holding the same funds yourself. We have worked through what harvested losses are actually worth in What “Tax Alpha” Actually Means, so this section deals only with how the benefit gets quoted.
Wealthfront’s pricing page says its harvesting “can typically cover our annual fee more than 6x over.”11 Its research white paper says “the median ratio of tax benefit to fee is 4.2x.”12 Both are medians, both have methodology notes attached, and both use the same arithmetic: take the harvested losses, multiply short-term losses by the client’s estimated marginal rate and long-term losses by their long-term gains rate, and divide by fees paid. Neither document says why the two results differ. The pricing page restricts its figure to Automated Investing clients on the Classic portfolio, the white paper covers everyone who used harvesting for at least a year, and the windows differ as well: the 97% figure beside the 6x is computed on clients from 2012 through 2023, the 6x tooltip states no window at all, and the white paper runs through December 2025. A different population is the likeliest explanation. The paper also says who falls short: clients whose benefit did not cover the fee “tend to be invested in lower-risk portfolios and live in states with low or no taxes.” What matters more is what both numbers have in common.
Each of them is a gross tax saving. The same white paper, a few sections earlier, defines the economic value of a harvested loss as the current tax saving minus the present value of the larger tax bill created by lowering your cost basis, and in its worked example a 4.5% harvesting yield on a $100,000 portfolio turns into a net benefit of 0.78% for a lower-rate investor and 1.38% for a higher-rate one. The firm is right about the concept, and says so plainly: harvesting “can be used to defer tax liabilities, not avoid them,” with “very little value if applied over a short investment horizon.” The headline ratio, in the paper and on the pricing page alike, is computed without that subtraction. The measure the firm itself says is correct is the one that does not make it into the headline.
Michael Kitces made the same point a decade earlier with an example worth keeping.13 Harvest a $6,000 loss on a position now worth $14,000 and, at a 15% rate, you have booked a headline “tax alpha” of 6.4%. Recover the position later and the lowered basis hands the same amount back. What remains is the growth on a deferred tax bill, plus any difference between the rate you deducted at and the rate you eventually pay. For a 30% decline followed by 7% annual growth, which he describes as one of the most favourable cases available, he puts the value at almost 0.30% a year at 15% rates and 0.42% at 23.8%, falling just below 0.20% and 0.30% in the long run. Modest but not trivial, in his words.
Two cases make it worse rather than better, and no questionnaire can see either one. If you have no capital gains to offset, up to $3,000 of net losses a year comes off ordinary income, which at a 32% or 37% marginal rate against a later 15% or 20% gains rate is the clearest rate arbitrage harvesting offers, and it is capped there. Beyond that, harvesting mostly generates carryforwards that end up offsetting the gains harvesting itself created. And if you harvest at 15% for years and the recovered gains eventually land in a higher bracket, the strategy can destroy value outright.
This is the structural limit on automated tax management. A robo optimises harvesting yield because harvesting yield is the only one of these quantities it can observe. It does not see, unless you tell it, the gains in your brokerage account elsewhere, your spouse’s IRA purchases, or what bracket you will be in when you sell. The SEC makes a general version of the point in its guidance to robo-advisers, which asks them to disclose that questionnaire answers “may be the sole basis for the robo-adviser’s advice” and warns against implying that a harvesting service amounts to comprehensive tax advice.14
When the software claim was wrong
There is a further wrinkle in buying tax automation, which is that you are buying a claim about a program you cannot inspect.
In December 2018 the SEC censured Wealthfront Advisers and imposed a $250,000 penalty in a settled order that also covered undisclosed testimonials and referral payments. The part that matters here is the harvesting claim.15 Its harvesting white paper had said the firm “monitors all the accounts it manages for each client to avoid any transactions that might trigger a wash sale.” Per the order: “This statement was false,” the software “was not programmed to monitor all the accounts it manages,” and “at least 31 percent of accounts enrolled in Wealthfront’s TLH strategy experienced some wash sales.” Those wash sales came to about 2.3% of losses harvested between 2014 and 2016.
That is eight years old and was remediated, and the firm’s current white paper states the deferral point plainly. The durable lesson is about the category. When a provider tells you its software avoids a tax trap, you have no way to check, and when a regulator did check, it found the claim false.
What a robo-advisor actually costs
Comparing headline advisory fees will mislead you, because the five major providers charge for the same service in economically different places.
| Provider | Advisory fee | Where the rest of the cost sits |
|---|---|---|
| Wealthfront | 0.25% | Fund expense ratios are charged on top, and are not rebated. |
| Betterment | $5 a month, or 0.25% above a balance and deposit threshold | Fund expenses on top. A flat-dollar option makes small balances expensive in percentage terms. |
| Fidelity Go | $0 below $25,000, then 0.35% | Uses Fidelity Flex funds, which charge no fund expenses. The advisory fee is the whole cost. |
| Vanguard Digital Advisor | 0.20% index, less a credit for fund revenue | Fund expenses are credited back against the advisory fee. |
| Schwab Intelligent Portfolios | No advisory fee | Funded partly by a required cash allocation held at Schwab Bank, as described in a 2022 SEC order. |
That last row has a documented history. In June 2022 Schwab entities paid $186.5 million to settle SEC charges over how the cash allocation in that product was described.16 From the order: “In order to offer SIP without charging an advisory fee, Schwab management decided that the SIP portfolios would collectively hold an average of at least 12.5% of their assets in cash,” with allocations ranging from 6% in the most aggressive portfolio to 29.4% in the most conservative, and Schwab “profited from the spread that Schwab Bank made by loaning the cash out at higher interest rates than it paid to the SIP clients.”
The order concerns disclosures Schwab has since revised; the mechanism is what matters. A mandatory cash sleeve in an aggressive portfolio is a real cost, it just arrives as forgone return rather than as a line on a statement. The sensible comparison is advisory fee, plus fund expenses, plus any cash drag, plus the tax consequences of ever leaving. On that last point: a taxable robo account held for a decade accumulates hundreds of tax lots and embedded gains, so switching later is not free even when the assets transfer in kind.
Who a robo-advisor fits
| If you are | Our read |
|---|---|
| New, and stuck on how to build a portfolio | Strong fit. Getting a sensible diversified portfolio implemented at all is most of the battle, and the research says this group gains the most. |
| Prone to tinkering, or to selling in drawdowns | Strong fit. Default implementation is the part that demonstrably works; in the Vanguard sample, cash holdings fell from 19% to 2% after adoption. |
| Busy, and happy to pay to not think about it | Reasonable. Convenience is a real good. Buy it deliberately. |
| A disciplined index investor, mostly in retirement accounts | Weak fit. You already capture the diversification and the low costs, harvesting does nothing in an IRA, and the evidence says a tool like this adds little for people who were already diversified. |
| Disciplined, with a large high-tax taxable account | Possibly worthwhile. Quantify it rather than assuming it, and ask for the benefit net of the future liability. |
| Running a complex household: concentrated stock, equity comp, a business, estate questions | Too narrow a tool, however good the portfolio management is. |
Try it: what did the allocation explain?
Put any advertised return in, set the risk level of the portfolio it came from, and see what a free index portfolio at the same risk returned over the same years.
What we recommend
Buy a robo-advisor for the automation, if you need the automation. Do not buy one because of a number on a chart.
For a beginner, a chronic tinkerer, or anyone whose cash has been sitting uninvested for months, 0.25% is cheap for a service that makes the decision once and then executes it forever. The experimental evidence that defaults beat recommendations is the cleanest finding in this literature, and it is a finding about behaviour rather than about markets.
For someone already holding a handful of broad index funds, contributing automatically and rebalancing once a year, the case is much weaker. You have already captured the market return, the diversification and the low costs. What is left for the fee to buy is tax management whose value depends on facts about you that the software cannot see, and discipline you have already demonstrated.
And when you do compare, compare properly. Match the risk level, match the period, subtract the fees and the fund expenses, and only then ask what is left over. Wealthfront’s own risk ladder is the cleanest illustration available of why that matters: the same firm, in the same years, reported anything from 4.80% to 9.80% depending on nothing more than how much stock the client held.
Frequently Asked Questions
Is Wealthfront’s 9.8% return real?
Yes. It is actual client performance for the taxable Classic portfolio at risk score 9, net of advisory fees and expenses, before your own taxes, and it is recalculated daily. It reports realized performance rather than a forecast. What it isolates is the risk level: the same page reports 4.80% at the most conservative risk score over the same period.
Does a robo-advisor beat the S&P 500?
Over 2013 to 2025 a robo-typical global blend returned about 10.1% a year against 14.75% for the S&P 500, and Wealthfront’s own 9.80% trails the index for the same reason, so no. Over 2000 to 2012 the same weights returned about 5.1% against 1.6%, so yes. The S&P 500 is the wrong benchmark for a global portfolio in either direction; use one that matches what you actually hold.
Is tax-loss harvesting worth the 0.25% fee?
It depends almost entirely on you: whether you have realized gains to offset, your marginal rate, your state, your horizon, and whether you reinvest the savings. Ask a provider for the benefit net of the future tax liability created by the lower cost basis, not for gross harvested losses, which are the largest and least informative of the numbers available.
Can I just copy a robo-advisor’s portfolio?
Largely, yes, for the parts that are published. Wealthfront discloses ticker-level weights at one risk score, and those six funds are available to anyone. What you would be giving up is the automation: rebalancing, getting deposits invested, and the harvesting. Whether that is worth 0.25% is the actual question, and it has a different answer for different people.
Are robo-advisors safe?
They are registered investment advisers, and client assets sit at SIPC-member brokerages, so the ordinary custodial protections apply. Investment losses are not covered by any of that. Both Wealthfront and Schwab have settled SEC charges over how their automated products were described, in 2018 and 2022 respectively, which is an argument for reading the disclosure rather than the headline.
Key Takeaways
- An advertised return mostly measures an allocation and an era. Wealthfront’s own page reported between 4.80% and 9.80% a year over the same period depending only on the risk score selected.
- Match the risk before comparing anything. The published risk-8 weights, held as index funds before fees, returned 10.12% a year over 2013 to 2025 and 5.09% over 2000 to 2012.
- The value of a robo is execution. In a controlled experiment, algorithmic advice cut a costly mistake by about a third while implementing that advice by default almost eliminated it.
- Benefits concentrate among those who needed help. In one study of a stock-portfolio optimiser, investors who were already diversified saw no performance change and traded more.
- Gross harvested losses and economic benefit are different numbers. Wealthfront’s 6x and 4.2x benefit-to-fee figures are both gross tax savings; the net measure its own white paper defines never reaches a headline.
- A zero advisory fee is not a zero cost. Schwab paid $186.5 million over disclosures about the cash allocation that funded its no-fee robo.
Related Guides
- What “Tax Alpha” Actually Means prices a harvested loss under every exit path, which is the arithmetic missing from the 6x and 4.2x claims above.
- AUM vs. Hourly vs. Flat-Fee covers how to pay for human advice, and where a digital service fits among the options.
- Do You Need a Financial Advisor? for the prior question of whether you need advice at all before asking who should deliver it.
- Do You Actually Need Direct Indexing? takes the harvesting question up a tier, to the service robo-advisors sell above $100,000.
- How Often Should You Rebalance? on why automatic rebalancing controls risk rather than adding return.
- Return on Hassle for putting a number on the convenience half of the decision.
Sources
- Wealthfront. Historical Investment Performance and the disclosure on its investing page. Figures read September 14, 2026, page as of September 13, 2026. The full risk-score ladder is committed at
data/wealthfront_risk_ladder.json. - Wealthfront. Classic portfolio, example allocation at risk score 8.0 of 10. Fee schedule, minimums and the treatment of fund expenses are from Wealthfront Advisers’ Form ADV Part 2A, July 2026.
- Markowitz, H. (1952). Portfolio Selection. The Journal of Finance 7(1), 77–91.
- Fama, E. F., & French, K. R. (1993). Common risk factors in the returns on stocks and bonds. Journal of Financial Economics 33(1), 3–56.
- Rossi, A. G., & Utkus, S. P. (2024). The diversification and welfare effects of robo-advising. Journal of Financial Economics 157, 103869. Vanguard Personal Advisor Services, a hybrid with human advisers; more than 55,000 previously self-directed investors who signed up 2015–2017. The authors describe the results as descriptive rather than causal.
- D’Acunto, F., Prabhala, N., & Rossi, A. G. (2019). The Promises and Pitfalls of Robo-Advising. The Review of Financial Studies 32(5), 1983–2020. An Indian brokerage’s stock portfolio optimiser over a menu of up to 15 stocks.
- Lambrecht, M., Oechssler, J., & Weidenholzer, S. (2026). On the Benefits of Robo-Advice in Financial Markets. The Economic Journal. Pre-registered online experiment, about 1,000 UK participants, ten weeks. Figures quoted are from the authors’ working-paper version (Heidelberg AWI Discussion Paper 734). The algorithm is optimal by construction, so the result measures the value of removing implementation friction given correct advice.
- Morningstar (2026). Mind the Gap 2026. Ten years to December 2025; 8.7% investor return against 9.9% total return.
- Fulkerson, J. A., Jordan, B. D., Riley, T. B., & Yan, Q. (2026). Bad Timing Does Not Cost Investors 15% of Their Funds’ Returns: An Examination of Morningstar’s “Mind the Gap” Study. Financial Analysts Journal 82(3). Re-examines the sample behind Morningstar’s 2025 edition.
- Barber, B. M., & Odean, T. (2000). Trading Is Hazardous to Your Wealth. The Journal of Finance 55(2), 773–806. 66,465 households, 1991–1996, a high-commission and pre-decimalization era.
- Wealthfront. Pricing. The 6x figure and its methodology tooltip read September 14, 2026. The tooltip describes the result as a median and computes the benefit as harvested losses multiplied by estimated tax rates, divided by fees paid.
- Wealthfront (April 27, 2026). Tax-Loss Harvesting white paper. Median benefit-to-fee ratio of 4.2x, computed as harvested losses multiplied by estimated tax rates, with the stated assumption of full utilization of losses. The same paper separately defines economic benefit net of the present value of the future tax liability.
- Kitces, M. (December 3, 2014). Evaluating The Tax Deferral And Tax Bracket Arbitrage Benefits Of Tax Loss Harvesting, Nerd’s Eye View.
- SEC Division of Investment Management (February 2017). IM Guidance Update No. 2017-02, Robo-Advisers.
- SEC (December 21, 2018). In the Matter of Wealthfront Advisers LLC, Advisers Act Release No. 5086, AP File 3-18949. $250,000 penalty, censure and cease-and-desist.
- SEC (June 13, 2022). In the Matter of Charles Schwab & Co., Inc., Charles Schwab Investment Advisory, Inc., and Schwab Wealth Investment Advisory, Inc., Release No. 34-95087, AP File 3-20897. $186,536,861 in disgorgement, interest and penalties.
Competitor fees in the cost table are from each provider’s own pricing pages, read September 14, 2026. Schwab Intelligent Portfolios’ current fee schedule and minimums were not independently verifiable at the time of writing; the cash-allocation description comes from the SEC order rather than from Schwab.
More in Getting Started
Browse all getting started guidesGet new guides by email
Evidence-based, no jargon. At most two emails a month. Unsubscribe any time.
Try it in Summitward
See portfolio factor analysis in action with your own financial data. Free to start, no credit card required.