

Why I Rent an Apartment With Over $3 Million in Liquid Net Worth
About 3% of U.S. millionaire families rent, per the 2025 SCF. Why I am one of them, who the others are, and the after-tax math of renting vs. owning a home.
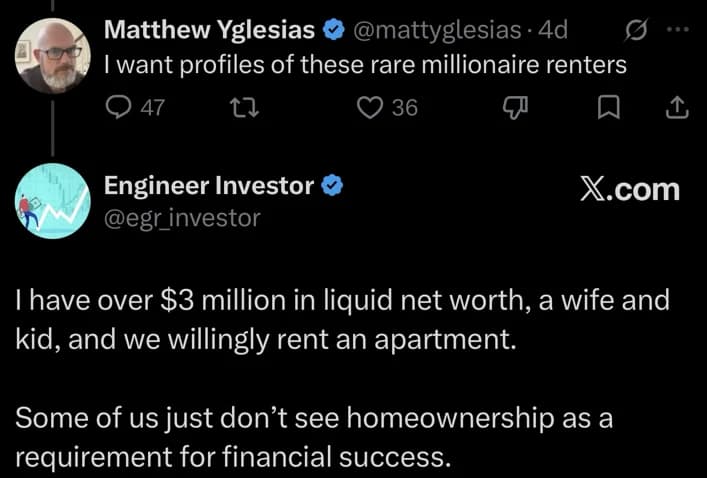
From my Engineer Investor account (@egr_investor) on X, October 13, 2026, replying to Matthew Yglesias.
Disclosure: I write both Summitward and the Engineer Investor account.
On October 13, Matt Bruenig posted a People’s Policy Project chart built from the Federal Reserve’s new 2025 Survey of Consumer Finances. Families with at least $1 million of net worth made up 21.5% of U.S. families, and 96% of them owned their home.1 Matthew Yglesias replied that he wanted profiles of these rare millionaire renters.2 I am one, so I answered.
One family’s reply is an anecdote, so I ran the numbers. The 2025 SCF microdata came out on October 9, and it is the best public source on what American households own.3 This guide reports what it says about wealthy renters, explains why I rent, and lays out the strongest reasons a family in my position might buy instead.
The short version
About 3% of U.S. families with $1 million or more of net worth rent their home, roughly 940,000 families, against 33% of all families. The share stays between 3% and 5% at every wealth level up to $10 million, roughly doubles for millionaires under 45, and did not rise between the 2022 and 2025 surveys. Once a household already has the money, the case for buying shifts from building wealth to hedging future rent and buying stability. For one modeled couple paying cash for a $1.5 million home at October 2026 rates, owning cost about $5,500 a month in year one after counting forgone interest and expected appreciation, so renting a comparable home for less than that was cheaper. Neither choice reliably builds more wealth. Renting suits households that may move and will invest the difference; owning suits families who will stay a decade or more.
Why I rent
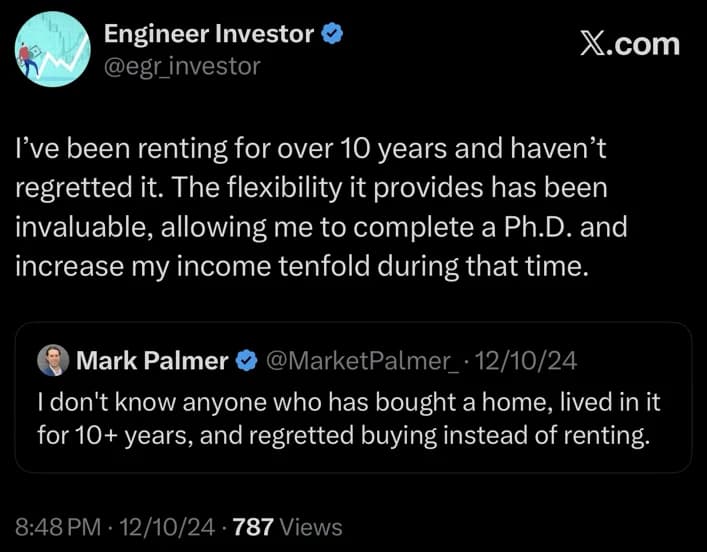
@egr_investor on X, December 10, 2024.
I have rented for more than a decade. In that time I finished a PhD while working, moved for jobs when a better one came along, and kept almost all of our net worth in diversified index funds that I can sell in a day. My income rose about tenfold over the same stretch. Renting meant a job offer in another city was a question about the job, with no house to sell, no listing to time, and no mortgage rate to give up.
I cannot tell you how much of that income growth renting caused, and the best evidence says probably little. Sodini, Van Nieuwerburgh, Vestman and von Lilienfeld-Toal studied a Swedish natural experiment in which tenants of converted apartment buildings got the chance to buy their units, so ownership was close to random. Owning raised households’ wealth, mostly through price appreciation, and had no measurable effect on labor income, labor force participation or unemployment. It even raised mobility among young households, who used the equity to move up the property ladder.4 A Danish study found homeowners less likely to move for work but quicker to find local jobs.5 The claim that owning a home hurts your career has weak support. My story is one data point about what flexibility was worth to me.
I have never framed renting as permanent. In 2023 I wrote that I would likely buy a home at some point, as a lifestyle decision, when it suits my family.6 That is still the plan. The rest of this guide is about what “suits” should mean in numbers.
How rare are millionaire renters?
I reproduced Bruenig’s figures from the Fed’s public data: 21.5% of the 135 million U.S. families had net worth of $1 million or more in 2025, or 29.1 million families, and 96.1% of them owned their home. The same code reproduces the Fed’s published 65.6% homeownership rate and $215,900 median net worth, which is how I know the definitions line up.3, 7
A family that owns its home has the home’s equity counted in its net worth, so owning mechanically pushes families over a net worth threshold. To strip that out, the chart below also measures wealth excluding home equity, and by financial assets alone, which is the closest match to the “liquid net worth” in my post.
Four things stand out.
- The share is small at every level. 3.2% of families with $1 million or more of net worth pay rent (95% confidence interval 2.3% to 4.1%). Another 0.7% neither own nor pay rent; they live with relatives, in employer housing, or rent-free. Among families with $3 million or more in financial assets, which describes my household, 5.0% rent (2.0% to 8.0%).
- It does not rise with wealth. From $1 million to $10 million, every estimate sits between 3% and 5% and every interval overlaps. Owning a primary residence is close to universal among the wealthy at every rung the survey can measure.
- Age matters more than wealth. Among families under 45 with $1 million or more excluding home equity, 10.4% rent (5.2% to 15.5%). Among those 65 and older, 3.2% do. Part of the 96% figure is that 44% of millionaire families are headed by someone 65 or older, who have had decades to buy and settle.
- No sign of a millionaire-renter boom. In the 2022 survey, measured in 2025 dollars, 5.1% of millionaire families rented (3.6% to 6.6%). In 2025 it was 3.2%. The intervals barely overlap, so the drop may be noise, but nothing in the survey points to a rise.
That last point conflicts with recent headlines. RentCafe reported on October 15 that “millionaire renter households” grew 229% to 18,400.8 RentCafe defines a millionaire by income of $1 million or more in a single year, which is a different and much smaller group than families with $1 million of wealth. Its incomes are nominal, so inflation alone pushes more households over a fixed $1 million line. And it compares the 2016–2020 and 2020–2024 American Community Survey five-year files, which share 2020; the Census Bureau advises against comparing overlapping five-year estimates.9 Redfin’s report that wealthier renters gained share in 35 of the 50 largest metros also defines wealth by local income rank.10 Neither tells you how many households with millions in assets choose to rent.
Who the millionaire renters are
The SCF lets me answer Yglesias directly, with one caveat. Only 58 sampled families are millionaire renters, so the medians below are rough. Treat differences of a few points as noise.
| Families with $1M+ net worth, 2025 | Renters | Owners |
|---|---|---|
| Families (millions) | 0.94 | 27.9 |
| Median age of family head | 55 | 63 |
| Head under 45 | 24% | 12% |
| Median income | $259,000 | $202,000 |
| Median net worth | $2.8M | $2.4M |
| Median financial assets | $1.34M | $1.10M |
| Median stock share of financial assets | 55% | 50% |
| Own other real estate | 39% | 47% |
| Own a business | 38% | 34% |
| Married | 70% | 80% |
| Children in the household | 38% | 38% |
Source: Summitward analysis of the Federal Reserve 2025 Survey of Consumer Finances. Renters are non-owners who report paying rent. Stock share includes stock held through funds and retirement accounts.
The typical millionaire renter is younger and higher-earning than the typical millionaire owner, with somewhat more in financial assets. Many are not avoiding real estate: about two in five own other property, a vacation home or rentals, while renting where they live. That fits a picture of mid-career professionals who have not settled, plus a group of investors who prefer to own real estate as a business and rent as consumers. It is also a reminder that “renter” and “not exposed to housing” are different things.
Families shaped like mine are a thin slice of the survey. Among married couples under 55 with children at home and at least $1 million in financial assets, 4.4% rent (1.1% to 7.6%, 216 sampled families). At $3 million the estimate is 6.1%, but with only 122 sampled families the interval runs from zero to 13%.
What changes once you already have the money
A home you own delivers two things at once: a place to live, and an investment in one building on one street. The Bureau of Labor Statistics separates them when it measures inflation. It treats an owned home as a capital good and prices the shelter it provides at the rent the owner would pay to live there, called owners’ equivalent rent.11 Renting buys the first without the second.
For a household building its first $100,000, the bundle has a real advantage: a mortgage forces saving. When the Netherlands required new mortgages to amortize in 2013, Bernstein and Koudijs found households accumulated close to one extra dollar of wealth for each dollar of required principal, mostly by consuming less, with little offsetting reduction in other saving.12 That is a strong result, and it is the best argument for buying that applies to people who struggle to save. It matters much less to a household that already invests automatically every month. The forced-saving benefit shrinks as the habit it replaces gets stronger.
What grows instead is the cost of concentration. A $1.5 million home would be about half of a $3 million balance sheet, tied to one local economy, one building, one insurance market and one property tax assessor. Summitward’s high-earner affordability guide suggests keeping a home under about 60% of net worth for this reason. The calculator below shows how much of your own balance sheet is in your house and how much you could spend from.
Mobility is the third difference. Renting keeps the option to move cheaply. It is worth more when your career, your family’s needs or your preferred city are uncertain, and worth little once they are settled. Options like this are real, but I do not know of any credible way to put a single annual percentage on one, so I will not invent one.
One modeled couple: the year-one cost of owning a $1.5 million home
A mortgage payment is not the cost of owning, because part of it is principal, which moves money from your bank account into your home equity. The economic cost is the “user cost” of Himmelberg, Mayer and Sinai: the return you give up on the money tied up in the house, plus interest, property tax, insurance and upkeep, minus tax savings and expected appreciation.13 If a comparable home rents for less than the user cost, renting is cheaper that year.
Here is that calculation for one modeled couple, married filing jointly, with income above $606,000, in a state whose income tax already uses up their capped deduction for state and local taxes. The home costs $1.5 million. Rates are from mid-October 2026: a 7.40% 30-year fixed mortgage and a 5.19% 10-year Treasury.14, 15 Three 2026 tax rules matter at this income. The deduction for state and local taxes is $40,400 but phases down to a $10,000 floor above about $606,000 of income, so property tax adds no deduction for this couple.16 Mortgage interest is deductible only on the first $750,000 of debt.17 And the itemized deductions have to beat the $32,200 standard deduction before they save anything.
| Year one, 10-year stay | Pay cash | 20% down |
|---|---|---|
| Forgone return on cash in the house (3.18% after tax) | $48,600 | $10,500 |
| Mortgage interest at 7.40% | $0 | $88,400 |
| Property tax (1.0%) | $15,000 | $15,000 |
| Insurance (0.35%) | $5,300 | $5,300 |
| Maintenance, depreciation and HOA (2.0%) | $30,000 | $30,000 |
| Buying and selling costs (8%), spread over 10 years | $12,000 | $12,000 |
| Federal tax saving | $0 | −$11,600 |
| Expected appreciation (3.0%) | −$45,000 | −$45,000 |
| Annual cost of owning (monthly) | $65,800 ($5,490) | $104,600 ($8,720) |
One modeled couple; every input is an assumption. The forgone return is the 10-year Treasury yield after a 35% federal rate and the 3.8% net investment income tax. The 20% down column includes 2% closing costs in the cash tied up. Code: user_cost_example.py.
For this couple paying cash, owning the $1.5 million home costs about $5,500 a month in year one. If a comparable home rents for less than that, renting is cheaper. Borrowing makes owning more expensive here, because the mortgage costs 7.40% and most of the interest is not deductible, while the cash it frees up earns 3.18% after tax in Treasuries.
Three assumptions move the answer most.
- How long you stay. Buying and selling cost about 8% of the price. For the cash buyer, a 5-year stay raises the monthly cost of owning to about $6,500; a 20-year stay lowers it to about $5,000.
- Appreciation. Each percentage point of expected annual price growth is worth $15,000 a year, or $1,250 a month, on this house. The 3% assumption is about 0.7 points above the bond market’s 2.32% 10-year inflation expectation.
- What the cash would otherwise earn. Charging the cash buyer a 7.5% expected stock return, less 0.6% of tax drag, raises the cost of owning to about $10,200 a month. That comparison sets a risky expected return against the house without charging the house for its own risk, so it tilts toward renting. Himmelberg, Mayer and Sinai add a separate housing risk premium for that reason. The Treasury rate is the tougher test for renting, which is why the table uses it.
For a fuller multi-year comparison with your own inputs, including the renter investing the difference, use the rent vs. buy guide and the Summitward housing tool.
Run rent vs. buy with your own numbers
Compare renting and owning month by month, with your price, rent, rate, taxes and holding period, and see the net worth gap at the end.
Open the housing toolThe case for owning
Most wealthy families own, and their reasons hold up.
- Owning hedges future rent. A renter is exposed to whatever rents do over the next 30 years. Sinai and Souleles showed that this rent risk, for most households, outweighs the price risk of owning, and that the hedge is worth more the longer a family expects to stay and the more volatile local rents are.18 A family that knows where it will live for 20 years has locked in its housing cost by buying. A renter has not.
- The rent you pay yourself is untaxed. An owner gets housing services every year without paying income tax on them. Treasury estimates this untaxed imputed rent at $157 billion a year, the largest federal tax break for homeowners, larger than the mortgage interest and property tax deductions combined.19 The housing plan guide covers the figures. A married couple can also exclude up to $500,000 of gain when they sell.20
- Fixed-rate borrowing. A 30-year fixed mortgage is cheap, long-term, prepayable borrowing that renters cannot get. At 7.40% it is less attractive than it was in 2021, but buyers who locked in 3% hold an asset that beats cash in most rate scenarios.
- Control and stability. No landlord sells the building, no renewal surprises you, and you can renovate. For families with school-age children, staying put has value no spreadsheet captures.
- Forced saving. For anyone who does not reliably invest the difference, the mortgage does the saving for them. That is most people.
Twenty years of Canadian rent-versus-own results
The most careful historical test of renting and investing against owning is by Ben Felix and Hamza Bin Arif at PWL Capital. It compares owning a condo with renting a similar one and investing the savings in 12 Canadian cities from 2005 to 2024.21 Renting at least matched owning in seven of the 12. The ratio of renter to owner ending wealth ranged from 0.37 in Calgary and 0.39 in Edmonton to 2.93 in Winnipeg.
In June 2025 I shared Felix’s video version of this work, which said renters ended with 1.17 times owners’ wealth on average.22, 23 That 1.17 is a simple average of the city ratios, and Winnipeg’s 2.93 pulls it up. For ratios, a geometric mean is the fairer summary, because a city where renters end with twice the wealth and a city where they end with half should cancel out. The published paper reports the geometric mean, 0.99: essentially a tie. Felix’s February 2026 update through 2025, a strong year for stocks and a weak one for Canadian condos, puts the geometric mean at 1.14.24
The paper’s sensitivity tests matter more for a U.S. reader than the headline. If the renter invests 80% of the savings instead of all of it, the geometric ratio falls to 0.79. If the renter holds 60% stocks and 40% bonds instead of all stocks, it falls to 0.68. The renter’s portfolio is untaxed because it sits in Canadian tax-sheltered accounts, which a U.S. household with millions in a taxable account cannot replicate. The study shows that renting can keep up with owning when the renter invests every dollar in stocks. It does not show that renting usually wins.
Across 16 countries since 1870, Jordà and coauthors found that housing and equities earned similar real returns, about 7% a year, with housing far less volatile.25 Those are returns on national housing stocks, net of maintenance and including rent. They are not the return on one leveraged house after an 8% round trip.
What would make me buy
The analysis above points to three conditions, and they are the ones I watch. The first is a long expected stay: once our family expects to live in one place for ten years or more, transaction costs shrink and the rent hedge grows. The second is price: when the user cost of a home we would want falls to around the rent on a comparable one. The third is the home itself: a house with space we need that the rental market near us does not offer at a reasonable price.
None of those is a statement about status or about renting being smart. Buying a home would be a choice about how we want to live, priced against renting, and paid for out of a balance sheet that does not need the house to be a great investment.
Who should rent and who should buy
| Situation | What usually decides it |
|---|---|
| Career or city likely to change within 5 to 7 years | Transaction costs of 8% or more favor renting. |
| Family settled in one community for 15+ years | The rent hedge, untaxed imputed rent and stability favor owning. |
| Saves inconsistently | Forced saving through a mortgage is a large, proven benefit. |
| Invests automatically and heavily | Forced saving adds little; compare user cost with rent directly. |
| Large stake in an employer or in local real estate | A local home adds to concentration; renting avoids stacking it. |
| Retiree with a long horizon in one place | Owning outright fixes most housing cost; renting keeps the capital liquid. Test both against the spending plan. |
Frequently asked questions
What share of millionaires rent?
In the Federal Reserve’s 2025 Survey of Consumer Finances, 3.2% of U.S. families with net worth of $1 million or more pay rent for their home, and 3.9% do not own it. That is about 940,000 renting families. Excluding home equity from net worth, the renting share is 4.5%.
Is renting throwing money away?
No more than owning is. Rent pays for housing. An owner pays for housing too, through interest, property tax, insurance, maintenance and the return given up on the down payment. Compare rent with that total, the user cost, rather than with the mortgage payment.
Are millionaire renters increasing?
Not by net worth. The share of millionaire families renting was 5.1% in the 2022 SCF and 3.2% in 2025. Reports of millionaire renters tripling count households with $1 million of income in one year, use nominal dollars and compare overlapping Census survey periods.
Does homeownership make people rich?
It helps, partly through forced saving and partly through appreciation on a leveraged asset; the Swedish and Dutch studies cited above find real causal effects. But the 96% ownership rate among millionaires mostly reflects that wealthier and older families buy homes, and that home equity counts toward net worth.
Should a wealthy family pay cash for a house?
At October 2026 rates, for a high-income couple whose extra interest is mostly not deductible, paying cash was cheaper than a 7.40% mortgage in our example, because Treasuries paid only about 3.2% after tax. The trade-off is liquidity and concentration: paying cash puts more of the balance sheet into one illiquid asset.
Key takeaways
- About 3% of U.S. families worth $1 million or more rent their home, and the share stays near 3% to 5% at every wealth level up to $10 million.
- Millionaire renters skew younger and higher-income, and two in five own other real estate.
- Wealth does not create an obligation to own. Once you already have the money, forced saving matters less and concentration and mobility matter more.
- Compare rent with the user cost of owning: forgone return, interest, taxes, upkeep and transaction costs, net of expected appreciation. For one modeled couple paying cash for a $1.5 million home at October 2026 rates, that was about $5,500 a month.
- Owning wins on rent hedging, untaxed imputed rent and stability for families who will stay a decade or more.
- Historical comparisons, including the PWL Canadian study, show renting and owning close to a tie, with results that depend on how much of the savings the renter actually invests.
Related guides
- Rent vs. Buy: A Financial Analysis Beyond the Monthly Payment for the full multi-year comparison and the 2026 tax rules.
- Did Buying This House Beat Renting? 24 Years of Real Math for a real house and the renter-discipline assumption.
- How Much House Can High Earners Really Afford? for the balance-sheet ceiling on a home.
- Should You Count Your Home and Cars in Net Worth? for liquid versus total net worth.
- The True Cost of Owning a Home for the cash, economic and exit costs of owning.
- Is a 30-Year Fixed Mortgage an Inflation Hedge? for the conditions under which a fixed rate protects you.
- Fact-Checking JL Collins on The Diary of a CEO for the house-as-idle-money argument and its limits.
Sources
- Bruenig, M. (2026). “Millionaires vs. everyone else (2025)”, People’s Policy Project chart posted on X, October 13, 2026. Built from the 2025 Survey of Consumer Finances; its 21.5% and 96% figures match Summitward’s replication.
- Yglesias, M. (2026). Post on X, October 13, 2026.
- Board of Governors of the Federal Reserve System (2026). Changes in U.S. Family Finances from 2022 to 2025: Evidence from the Survey of Consumer Finances, October 2026. Homeownership 65.6%; median net worth $215,900; all dollar figures in 2025 dollars.
- Sodini, P., Van Nieuwerburgh, S., Vestman, R., & von Lilienfeld-Toal, U. (2023). Identifying the Benefits from Homeownership: A Swedish Experiment. American Economic Review, 113(12), 3173–3212.
- Munch, J. R., Rosholm, M., & Svarer, M. (2006). Are Homeowners Really More Unemployed? Economic Journal, 116(514), 991–1013.
- Engineer Investor (2023). Post on X, February 7, 2023: “I’ll likely buy a home at some point as a lifestyle decision when it suits my family.”
- Federal Reserve, 2025 Survey of Consumer Finances data and documentation: summary extract, bootstrap replicate weights, codebook and standard-error documentation. Summitward’s analysis code: summitward-research/millionaire-renter.
- Grecu, V. (2026). Millionaire renters more than triple in 5 years, nearly half are Millennials. RentCafe, October 15, 2026. Defines millionaires by annual household income of $1 million or more; nominal dollars; ACS 2016–2020 vs. 2020–2024 five-year files.
- U.S. Census Bureau. What are some general guidelines for using the ACS? “The Census Bureau discourages direct comparisons between estimates for overlapping periods.”
- Katz, L., & de la Campa, E. (2025). The Rise of the Rich Renter. Redfin, March 11, 2025. Affluent means top 20% of local household income.
- U.S. Bureau of Labor Statistics. How the CPI measures price change of Owners’ equivalent rent of primary residence and Rent of primary residence.
- Bernstein, A., & Koudijs, P. (2024). The Mortgage Piggy Bank: Building Wealth Through Amortization. Quarterly Journal of Economics, 139(3), 1767–1825.
- Himmelberg, C., Mayer, C., & Sinai, T. (2005). Assessing High House Prices: Bubbles, Fundamentals and Misperceptions. Journal of Economic Perspectives, 19(4), 67–92.
- Freddie Mac. Primary Mortgage Market Survey: the 30-year fixed rate averaged 7.40% as of October 15, 2026.
- U.S. Department of the Treasury. Daily Treasury Par Yield Curve Rates, October 14, 2026 (10-year 5.19%), and the corresponding real yield curve (10-year breakeven inflation 2.32%), via Summitward’s market data feed.
- Internal Revenue Service. Publication 505 (2026), Tax Withholding and Estimated Tax: the 2026 state and local tax deduction limit is $40,400, reduced above $505,000 of modified adjusted gross income, but not below $10,000.
- Internal Revenue Service. Publication 936, Home Mortgage Interest Deduction: interest deductible on the first $750,000 of home acquisition debt.
- Sinai, T., & Souleles, N. S. (2005). Owner-Occupied Housing as a Hedge Against Rent Risk. Quarterly Journal of Economics, 120(2), 763–789. (NBER Working Paper 9462)
- U.S. Department of the Treasury, Office of Tax Analysis. Tax Expenditures FY2027, Table 1, fiscal 2026: exclusion of net imputed rental income $157.4 billion; mortgage interest deduction $24.5 billion; property tax deduction $25.8 billion.
- Internal Revenue Service. Publication 523, Selling Your Home: up to $250,000 of gain excluded, $500,000 for married couples filing jointly.
- Felix, B., & Bin Arif, H. (2025). Renting vs. Owning a Home in Canada 2005–2024. PWL Capital, September 2025. Table 1 and sensitivity analyses.
- Engineer Investor (2025). Post on X, June 22, 2025, summarizing Ben Felix’s video.
- Felix, B. (2025). 20 Years of Renting vs. Buying a Home in Canada (2005 to 2024). YouTube, June 22, 2025. Source of the 1.17 simple average and the 48 five-year sub-periods.
- Felix, B. (2026). Renting vs. Buying a Home: The Reckoning. YouTube, February 22, 2026. Geometric mean renter-to-owner wealth ratio of 1.14 through December 2025.
- Jordà, Ò., Knoll, K., Kuvshinov, D., Schularick, M., & Taylor, A. M. (2019). The Rate of Return on Everything, 1870–2015. Quarterly Journal of Economics, 134(3), 1225–1298. (NBER Working Paper 24112)
Editor’s note
Educational content, not investment, tax, or legal advice. Survey figures are Summitward’s calculations from the Federal Reserve’s public 2025 and 2022 SCF files, run October 18, 2026; the code is linked above. Mortgage and Treasury rates are as of October 14 and 15, 2026, and 2026 tax limits were checked against IRS publications on October 18, 2026. The PWL figures are quoted from the September 2025 paper; the 2025 update and the 1.17 simple average come from Ben Felix’s videos.
More in Home & Big Purchases
Browse all home & big purchases guidesGet new guides by email
Evidence-based, no jargon. At most two emails a month. Unsubscribe any time.
Try it in Summitward
See rent vs. buy calculator in action with your own financial data. Free to start, no credit card required.