The Simplified Engineer Investor Portfolio: A 3-Fund All-Equity Portfolio With a Global Value Tilt
36% VTI, 24% VXUS, 40% AVGV: a Boglehead core with a global value tilt. The X-Ray, the equity style box, the evidence, and an interactive tilt explorer. Who it fits and who it does not.

The simplified Engineer Investor portfolio is a three-fund, all-equity model: 36% VTI, 24% VXUS, and 40% AVGV. It keeps the Boglehead core of broad, low-cost, market-cap-weighted index funds, then adds one deliberate tilt toward stocks with higher expected returns through a global value fund. The one-line positioning is “factor and value investors meet Bogleheads”: own the world market first, then lean modestly toward value, profitability, and smaller-company exposure.1
| Fund | Role | Weight |
|---|---|---|
| VTI | Total U.S. stock market core | 36% |
| VXUS | Total international stock market core | 24% |
| AVGV | Global value / profitability tilt | 40% |
Expense ratios: VTI 0.03%, VXUS 0.05%, AVGV 0.26%.2,3,4
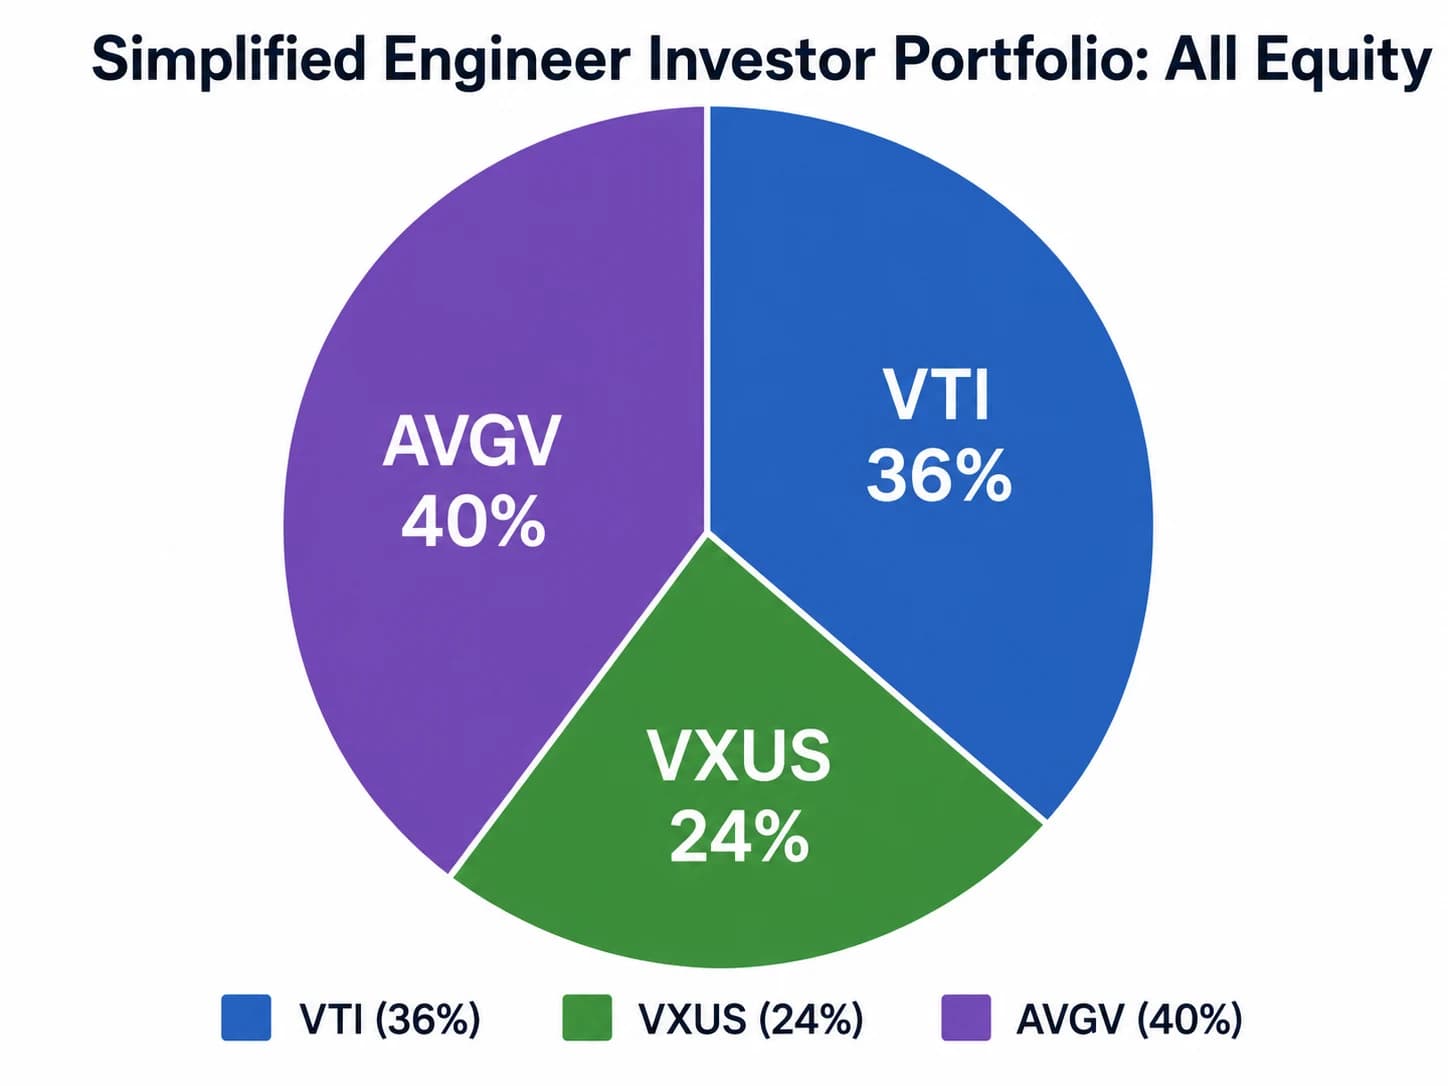
Source: Engineer Investor (@egr_investor). The simplified, all-equity three-fund model.
This guide takes the portfolio apart: how it differs from the original eight-fund Engineer Investor model, what it actually owns once you look through the funds, what the academic evidence does and does not support, and who should and should not consider it. There is an interactive explorer so you can adjust the tilt yourself.
The original Engineer Investor portfolio
The original model was a 90% equity, 10% bond, factor-tilted portfolio with eight sleeves: 39% U.S. total market (VTI/ITOT), 26% international (VXUS/IXUS), 10% U.S. small-cap value (AVUV/DFSV), 7.5% developed ex-U.S. small-cap value (AVDV/DISV), 2.5% emerging value (AVES/DFAE), 5% quality (QUAL/DUHP), 6.7% U.S. bonds (BND/AGG), and 3.3% international bonds (BNDX/IAGG).1

Source: Engineer Investor (@egr_investor). The original 90/10 factor-tilted model with eight sleeves.
That portfolio gives an investor independent control over U.S. small-cap value, developed ex-U.S. small-cap value, emerging value, quality, and bonds. The cost of that control is eight holdings to fund, monitor, and rebalance across accounts.
What changed, and why
The simplified version improves implementation, not guaranteed performance. It does three things:
- Eight holdings become three. The separate U.S. small-cap value, developed small-cap value, emerging value, and quality sleeves collapse into one global value fund, AVGV.
- The bond sleeves are removed. The portfolio goes from 90/10 to 100% equity. That raises both expected return and expected drawdown.
- One fund does the rebalancing. AVGV is a fund-of-funds that holds and reweights the underlying Avantis value ETFs internally, so the investor does not have to rebalance four factor sleeves by hand.2
The tradeoff is control. The original lets you tune U.S. small value, international small value, emerging value, quality, and bonds separately. The simplified model says: one robust global value allocation you will actually hold and rebalance beats five precise sleeves you might not. For many do-it-yourself investors, that is a behavioral improvement, since the portfolio you can stick with is worth more than the one that is theoretically optimal but exhausting to run.
What the portfolio actually owns
Looked at through the funds, the simplified model is a roughly 60/40 U.S./international all-stock portfolio with a clear value tilt. A Morningstar Portfolio X-Ray of the 36/24/40 mix shows 60.1% U.S. stocks, 38.9% international stocks, and about 0.9% cash, with no fixed income.5
It is also cheaper-looking and less concentrated in mega-cap growth than the S&P 500. The same X-Ray reports these characteristics against the S&P 500 benchmark:
| Characteristic | Portfolio | S&P 500 |
|---|---|---|
| Average market cap | ~$70B | ~$526B |
| Price / earnings | 19.23 | 27.09 |
| Price / book | 2.59 | 5.43 |
| Price / sales | 1.64 | 3.79 |
| Technology weight | 21.5% | 39.1% |
| Financials weight | 18.1% | 11.1% |
Lower multiples, a smaller average market cap, half the technology weight, and a heavier lean into financials and other cyclicals. That is what a value and smaller-company tilt looks like under the hood. It is a different portfolio from a cap-weighted index, and it will behave differently in the years when mega-cap growth leads.
The equity style box
The most useful picture of this portfolio is its Morningstar equity style box. The vertical axis is company size (large, mid, small); the horizontal axis is style (value, blend, growth). Each cell is the share of the stock portfolio that lives there.5
Percent of the stock portfolio in each size/style cell. Source: Morningstar Portfolio X-Ray, 05-31-2026.
The lesson surprises people who assume an Avantis value fund makes the portfolio small-cap. It does not. The two heaviest cells are large blend (24%) and large value (21%); about 60% of the stock portfolio is still large-cap. AVGV nudges the mix toward value and adds mid- and small-cap exposure the S&P 500 lacks, but the blended result stays anchored in large companies. Morningstar even classifies AVGV itself in the “Global Small/Mid” category, yet at 40% of the portfolio it shifts the whole picture only to a large-blend-with-a-value-lean profile, not a small-cap one.
Explore the tilt yourself
The model uses a 60% U.S. weight and a 40% value tilt. Neither is sacred. Use the explorer to see how changing the equity level, the home bias, and the size of the AVGV tilt changes the blended cost, the valuation discount, the U.S./international split, and the behavioral stress you are signing up for.
The short live record, and what it does not prove
AVGV launched on June 27, 2023, so any backtest of this exact portfolio is short.2 From July 2023 through May 2026, a Portfolio Visualizer backtest shows $10,000 in the simplified model growing to about $17,430, versus $17,206 for Vanguard Total World Stock (VT) as the benchmark. Annualized that is 20.98% for the portfolio against 20.45% for VT, with nearly identical volatility (12.42% vs 12.44%) and maximum drawdown (about 9.7% for both).6
Read that as description, not proof. The window is only 35 months, it began after AVGV’s 2023 launch, and it covered a strong equity period. The portfolio’s correlation to VT over the window was 0.98 and its tracking error was 2.56%, which points to the same takeaway: so far this has behaved like global equities, with the same risk and nearly the same return, while carrying different valuation, size, and sector exposures. A 35-month outperformance of half a percent a year is well inside noise. Do not treat it as evidence the tilt works; treat the academic record below as the actual case.
What the research says
The Boglehead half of the case is arithmetic. William Sharpe’s “Arithmetic of Active Management” shows that before costs the average actively managed dollar must earn the market return, and after costs it must trail, because active management is more expensive. That is the structural argument for a low-cost total-market core like VTI and VXUS.7
The factor half is that expected returns have historically differed by company characteristics beyond market beta. Fama and French found that size and book-to-market helped explain the cross-section of average stock returns, and their later five-factor model added profitability and investment.8 Novy-Marx showed that gross profitability had roughly the same predictive power as book-to-market and that adding it improved value strategies, especially among large, liquid stocks.9 Asness, Moskowitz, and Pedersen found value premia across many markets and asset classes, which is part of why value is treated as more than a U.S.-only historical accident.10 AVGV packages value, profitability, and a smaller-company lean into one global, actively-implemented fund, which is the same small set of economically motivated characteristics.
The caution is real and belongs in the same breath. Harvey, Liu, and Zhu documented that hundreds of factors have been published and argued that new ones need a much higher statistical bar because of data mining. McLean and Pontiff found that many published return predictors weakened out of sample and after publication.11 The defensible version of factor investing is not “harvest every anomaly,” it is a tilt toward a few well-studied, economically grounded characteristics: market, value, size, profitability, and investment. That is the bar AVGV’s design clears, and it is the only version of the case worth making.
For the building blocks in more depth, see the Case for Small-Cap Value, the Fama-French HML explainer, and the RMW profitability factor guide. For AVGV specifically, the AVGV review covers the fund in detail.
The cost is modest, but no longer free
The blended net expense ratio of the 36/24/40 mix is about 0.13%, based on VTI at 0.03%, VXUS at 0.05%, and AVGV at 0.26%.234 That is cheap by any historical standard, but it is roughly three times the cost of a plain VTI-plus-VXUS portfolio at around 0.04%. The extra nine basis points are the price of the tilt. AVGV is also actively managed and does not track a published index, so part of the outcome depends on Avantis’s implementation: which securities it overweights, how it weights the sub-funds, and how it trades. This is a rules-based, valuation-aware active strategy, not pure passive indexing, and the guide should not pretend otherwise.
See Your Own Portfolio's Tilts and Concentration
Use Summitward's Portfolio analytics to measure your factor exposures, single-stock concentration, U.S./international split, and cost, then model how a value tilt or a different allocation would change the risk you actually carry.
Open Portfolio analyticsThe home-bias question
The model holds 60% of its stocks in the U.S. That is a choice worth examining honestly. Global market capitalization is roughly 60 to 65% U.S., so 60% is close to market weight, not an obvious overweight. But the recent academic case for all-equity investing points the other way on geography. Anarkulova, Cederburg, and O’Doherty, studying 39 developed countries from 1890 to 2023, estimate that the welfare-maximizing all-equity lifetime allocation is closer to one-third domestic and two-thirds international stocks, not a domestic majority.12
Reasonable investors land in different places here. A 60% U.S. weight reflects a belief in continued U.S. corporate strength and a tolerance for the home-country concentration that comes with it; a higher international weight reflects the diversification and valuation case. The case for global diversification guide makes the argument for owning more of the rest of the world. The explorer above lets you set the U.S. weight anywhere from 40% to 80% and see the effect.
Who it makes sense for
This model fits a specific investor:
- Long accumulation horizon. All-equity portfolios need time and emotional durability to be worth the volatility.
- High risk tolerance. There is no bond ballast, so the full equity drawdown lands on you.
- Belief in global diversification. This is not an S&P 500 or U.S.-only portfolio.
- Belief in the value and profitability premia. A 40% AVGV weight is large enough to matter, for better and worse.
- A preference for simplicity. Three tickers are far easier to run than separate AVUV, AVDV, AVES, QUAL, and bond sleeves.
- The discipline to rebalance mechanically. Rebalancing is what turns a target allocation into a real strategy.
It is most compelling for someone who likes the Boglehead philosophy but thinks pure cap weighting has become too concentrated in U.S. mega-cap growth, and who wants a structured, low-maintenance way to lean against that.
Who it does not make sense for
It is a poor default for several investors:
- Anyone who needs the money soon or has low drawdown tolerance. A 100% equity portfolio can fall 40% or more; there is no ballast to soften it.
- Anyone near retirement without other stable income. Sequence-of-returns risk makes an all-equity mix fragile right around the retirement date.
- Anyone who wants pure passive indexing. AVGV is actively managed and depends partly on manager implementation.
- Anyone who would abandon the tilt after five to ten years of value underperformance. Selling a tilt at the bottom is worse than never tilting at all.
Asset allocation comes before fund selection. A 100% equity portfolio is a risk decision first. A 90/10, 80/20, or target-date-style allocation is more livable for many people, and that choice matters more than the VTI-versus-AVGV details. See 60/40, target-date, or 100% stocks and lifecycle asset allocation for how to set that first.
The recommendation
Treat the simplified Engineer Investor portfolio as an aggressive model for disciplined long-term accumulators, not as “the best portfolio.” It is a compact expression of three beliefs: own global equities, keep costs low, and modestly favor value, profitability, and smaller-company exposure that has long-run empirical and economic support. It is better than the original if your goal is clarity, maintainability, and the behavioral durability of a portfolio you will actually hold. It is not automatically better if your goal is maximum customization, explicit bond ballast, or pure passive indexing.
A portfolio does not need to be complicated to be evidence-based. It does need to be honest about what it owns, why it differs from the market, and what pain you have to survive to earn any premium.
Frequently asked questions
Is AVGV a passive index fund?
No. AVGV is actively managed and does not replicate a published index. It is a fund-of-funds that holds other Avantis ETFs and uses market prices and company financials to overweight securities with higher expected returns. It carries index-like features (low fee, broad diversification, tax efficiency) with daily active oversight, so the portfolio is best described as mostly passive with one rules-based active sleeve.
Why 40% in AVGV specifically?
Forty percent is large enough that the value and profitability tilt actually moves the portfolio’s characteristics, as the style box and valuation table show, while still leaving 60% in plain cap-weighted total-market funds. A smaller tilt would barely register; a larger one would start to look like a concentrated value bet rather than a tilt. It is a judgment call, not a number the research pins down, which is exactly why the explorer lets you set it from 0% to 60%.
Does the AVGV allocation make this a small-cap portfolio?
No. About 60% of the stock portfolio is still large-cap. AVGV adds mid- and small-cap exposure and pulls the average market cap down to roughly $70B from the S&P 500’s ~$526B, but the heaviest style-box cells are large blend and large value. It is a large-blend-with-a-value-lean portfolio, not a small-cap one.
Why not just hold VT?
VT (total world market) is the cleaner choice if you do not want a tilt at all, and over the short live record this portfolio has tracked VT closely. The entire reason to hold the simplified model instead is the deliberate value, profitability, and smaller-company tilt, which you are betting will add return over decades in exchange for years of tracking error. If you do not hold that belief, VT at a lower cost is the more honest portfolio for you.
Is 0.13% too expensive?
It is about three times the cost of a plain VTI-plus-VXUS portfolio (~0.04%), but still inexpensive in absolute terms. The right question is whether you believe the tilt’s expected premium exceeds the extra nine basis points plus the active-implementation risk. If you do, the cost is trivial; if you do not, you should not pay it.
Will the value premium keep working?
No one can promise it will. Value underperformed growth for much of the 2010s, and factor premia can shrink after they are published. The evidence-based stance is that a tilt toward a few economically grounded characteristics has a reasonable expected premium, not a guaranteed one, and that the premium only reaches investors who hold through long droughts. Size the tilt to what you can actually sit with.
Where are the bonds?
There are none. The simplified model is 100% equity by design, which raises both expected return and expected drawdown versus the original 90/10. If you want ballast, the cleanest change is to hold this as the equity portion of a broader allocation and add a total-bond fund on top, rather than altering the three-fund mix itself.
Related guides
- AVGV Review is the deep dive on the one fund doing the tilting here.
- If Ben Felix Uses One Fund, Do You Need Ten? places this three-fund build on a complexity ladder from one-fund simplicity to institutional sprawl.
- Should You Hold REITs? explains why a REIT sleeve is not part of this core three-fund build.
- Should You Own Emerging-Market Stocks? covers the EM share inside VXUS and AVGV: why it is there and how much is enough.
- The Case for Small-Cap Value covers the size-and-value evidence and the years of pain that come with it.
- The Case for Global Equity Diversification makes the argument for the international weight.
- 60/40, Target-Date, or 100% Stocks covers the equity-versus-bonds decision that comes first.
- Fama-French HML Explained and the RMW Profitability Factor unpack the factors AVGV harvests.
Sources
- Engineer Investor (@egr_investor), model portfolio posts: simplified three-fund model and the original factor-tilted model.
- Avantis Investors. Avantis All Equity Markets Value ETF (AVGV). Actively managed fund-of-funds, 0.26% net expense ratio, inception June 27, 2023.
- Vanguard. Vanguard Total Stock Market ETF (VTI). Tracks the CRSP US Total Market Index; 0.03% expense ratio.
- Vanguard. Vanguard Total International Stock ETF (VXUS). Tracks the FTSE Global All Cap ex US Index; 0.05% expense ratio.
- Morningstar Portfolio X-Ray of the 36/24/40 portfolio, 05-31-2026 (user-supplied report). Source of the 60.1%/38.9% U.S./international split, valuation and sector statistics, and the equity style box.
- Portfolio Visualizer backtest, July 2023 to May 2026 (user-supplied report). Benchmark: Vanguard Total World Stock ETF (VT). Source of the $17,430 vs $17,206 growth, 20.98% vs 20.45% returns, volatility, drawdown, 0.98 correlation, and 2.56% tracking error.
- Sharpe, W. F. (1991). The Arithmetic of Active Management. Financial Analysts Journal, 47(1), 7-9.
- Fama, E. F., & French, K. R. (1992). The Cross-Section of Expected Stock Returns. Journal of Finance, 47(2). And (2015), A Five-Factor Asset Pricing Model, Journal of Financial Economics, 116(1), adding profitability and investment factors.
- Novy-Marx, R. (2013). The Other Side of Value: The Gross Profitability Premium. Journal of Financial Economics, 108(1), 1-28.
- Asness, C. S., Moskowitz, T. J., & Pedersen, L. H. (2013). Value and Momentum Everywhere. Journal of Finance, 68(3), 929-985.
- Harvey, C. R., Liu, Y., & Zhu, H. (2016). … and the Cross-Section of Expected Returns. Review of Financial Studies, 29(1). And McLean, R. D., & Pontiff, J. (2016), Does Academic Research Destroy Stock Return Predictability?, Journal of Finance, 71(1) (post-publication decay of predictors).
- Anarkulova, A., Cederburg, S., & O’Doherty, M. S. (2023). Beyond the Status Quo: A Critical Assessment of Lifecycle Investment Advice. Estimates a welfare-maximizing all-equity allocation near one-third domestic and two-thirds international stocks.
More in Investing & Portfolio
Browse all investing & portfolio guidesGet new guides by email
Evidence-based, no jargon. At most two emails a month. Unsubscribe any time.
Try it in Summitward
See portfolio factor analysis in action with your own financial data. Free to start, no credit card required.