

Does Trend Following Work on Crypto? The Evidence, the Traps, and How to Test It Yourself
In one 2017 to 2025 test, a crypto trend rule cut the deepest loss from 84% to 15%, while plain volatility targeting captured most of the improvement.
The pitch is easy to find and easy to like: crypto moves in huge trends, so a rule that rides the trends and steps aside during the crashes should capture most of the upside with a fraction of the pain. Bitcoin’s history of 80%-plus drawdowns makes that sales pitch land harder in crypto than anywhere else.
The evidence deserves a more careful telling. Time-series momentum is one of the best-documented effects in finance, and it shows up in cryptocurrency returns specifically. But when I ran a research-grade trend strategy on real exchange data from 2017 through mid-2025, the drawdown half of the pitch held up and the return half mostly did not. In that test, the deepest loss fell from 84% for Bitcoin buy-and-hold to about 15% for the trend strategy, while a plain volatility rule with no trend signal at all captured most of the same improvement. The research, the test, and the characteristic ways crypto backtests go wrong all reward a closer look before you commit money to a rule.
What a trend rule does in crypto
Time-series momentum, the academic name for trend following, is a simple statement: an asset’s own recent past return predicts its near-future return. The canonical version from Moskowitz, Ooi, and Pedersen takes the sign of the trailing 12-month return, goes long when it is positive and short when it is negative, and sizes each position inversely to its recent volatility.1 Practitioners usually blend several horizons, most commonly 1, 3, and 12 months, because no single lookback is reliably best and the blend avoids betting on one.2 Real trend programs diversify further across signal families: total return momentum, price against a moving average, fast moving average against slow, and breakouts above or below a recent range. Research on replicating trend funds finds these families perform so similarly that hunting for the one magic indicator is a waste of effort; diversifying across simple versions of all four is the defensible choice.3
Applied to crypto, one fork in the road matters more than any indicator choice: long/short versus long/flat. The classical managed-futures hypothesis says to short falling markets, and the long-run futures evidence was built on long/short portfolios.4 The case for long/flat in crypto rests on crypto’s historically positive drift, the cost of maintaining short exposure, and the violence of short squeezes. Nearly every crypto trend product on the shelf today chose long/flat, which tells you something about what issuers think retail investors will hold through. If trend following as a concept is new to you, our managed futures guide covers the century of general evidence, the fund menu, and the tax treatment; our momentum taxonomy guide untangles the four different things people mean by “momentum.”
The crypto-specific evidence
Crypto is not just borrowing the futures literature’s credibility. Liu and Tsyvinski, in the Review of Financial Studies, found a strong time-series momentum effect in cryptocurrency returns: past performance of the crypto market predicted its future returns at horizons from one to eight weeks.5 Their later work with Wu, in the Journal of Finance, identified momentum as one of a small number of factors that price the cross-section of cryptocurrency returns.6 Man Group, which runs one of the oldest trend-following programs in existence, has argued that crypto is unusually well suited to trend following because of its volatility, around-the-clock liquidity, and weak fundamental valuation anchors: nobody agrees what a coin is worth, so prices can travel a long way before anything pulls them back. The same research finds the diversification benefit of adding coins to a trend portfolio peaks around 10 to 15 names, after which transaction costs and thin liquidity eat the gains.7
Keep the sample sizes in perspective. The general trend-following record runs back to 1880 across dozens of markets.4 The crypto record is roughly a decade of usable multi-asset data, containing perhaps three full boom-bust cycles. Every crypto backtest, including the one below, is a small sample reported with precise numbers.
The strongest critique: volatility scaling does a lot of it
The most important skeptical result in the trend literature comes from Kim, Tse, and Wald: a meaningful share of published time-series momentum performance is attributable to the volatility scaling step, which shrinks positions when markets get wild, rather than to the directional signal itself.8 For crypto, where volatility routinely runs five to ten times that of equities, this critique bites harder than anywhere else. Any honest test of a crypto trend strategy has to decompose the result into four variants: buy-and-hold, volatility-managed buy-and-hold, the raw trend signal without volatility scaling, and the full strategy. Here is that decomposition for the test described in the next section:
For the same scaling rule on a century of US stock data, see our guide to volatility targeting.
| Variant | Trend signal | Vol scaling | Sharpe | Max drawdown |
|---|---|---|---|---|
| Buy and hold | No | No | 0.73 | -84% |
| Vol-managed buy and hold | No | Yes | 0.74 | -17% |
| Raw trend, no vol scaling | Yes | No | 0.71 | -80% |
| Full trend strategy | Yes | Yes | 0.79 | -15% |
One test: BTC/ETH/SOL, Coinbase daily closes, 2017 through June 2025, equal-risk portfolio at a 10% volatility target where scaling is on, estimated trading costs included. Different data, dates, or settings would move these numbers.
Read the rows in the drawdown column. Volatility scaling alone, with no opinion about direction, took the worst loss from 84% to 17% in this sample. The trend signal without scaling barely dented it. Adding the trend signal on top of scaling improved the Sharpe ratio from 0.74 to 0.79 and the drawdown from 17% to 15%: real, but an increment. In this test, most of what the sales pitch attributes to trend detection was volatility management, exactly the pattern Kim, Tse, and Wald documented in conventional futures.8
One careful test on real data
The numbers above and below come from a single, fully specified test, so you know exactly what was and was not assumed. Instruments: Bitcoin, Ether, and Solana daily spot closes from Coinbase Exchange, January 2017 through June 2025, with Solana entering the portfolio only after accumulating a year of history under a point-in-time eligibility rule. Strategy: equal-weighted 1, 3, and 12-month time-series momentum, long/short, positions scaled inversely to a 60-day volatility estimate, portfolio targeted at 10% annualized volatility, and per-trade cost estimates of 1 to 4 basis points of traded value. That is the published academic recipe with crypto plumbing, and no parameter was tuned to this data.1
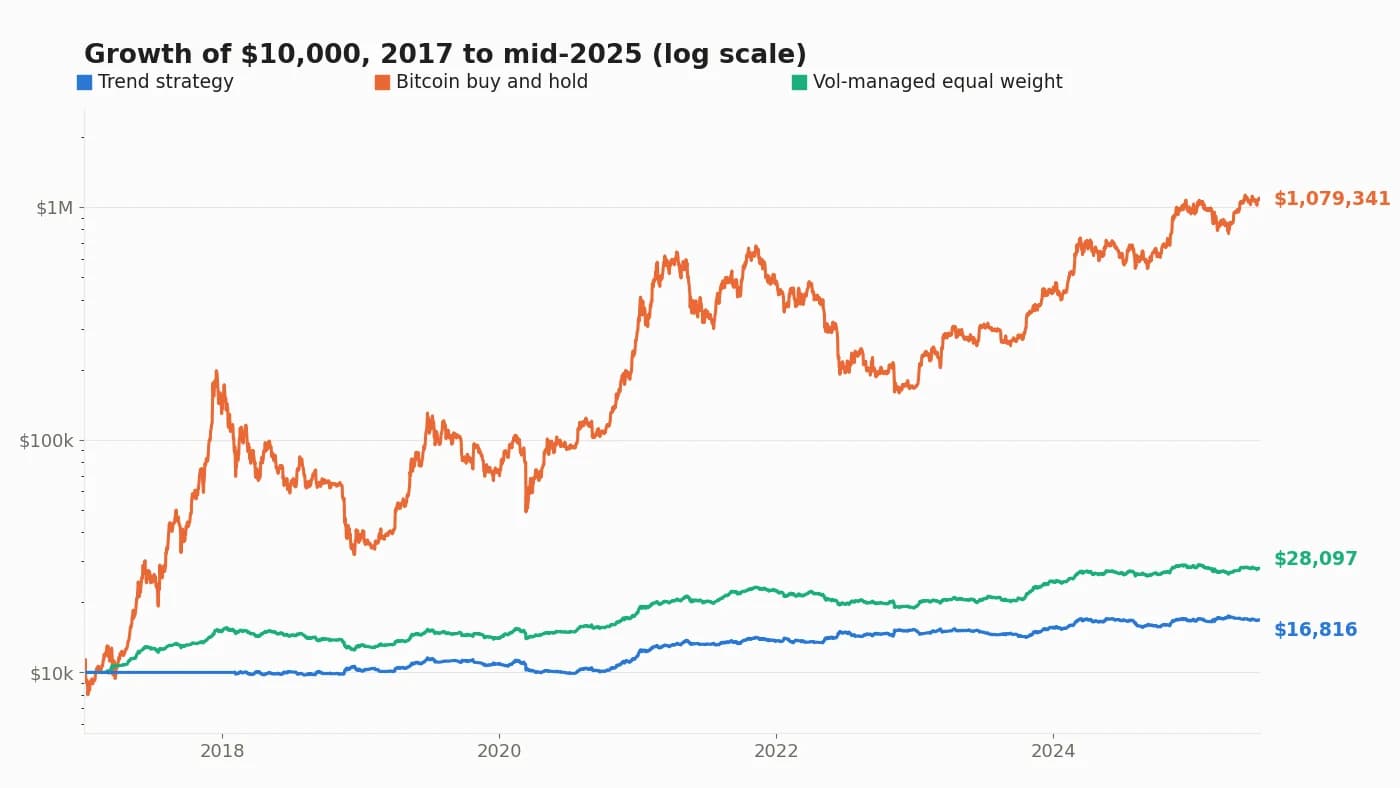
Growth of $10,000, log scale. Trend strategy as specified above; Bitcoin buy-and-hold; equal-weight BTC/ETH/SOL scaled to a 10% volatility target with no trend signal. Coinbase Exchange daily close data, 2017 through June 2025, estimated costs included for the trend strategy.
The growth chart carries the central result. At a 10% volatility target, the trend strategy turned $10,000 into about $16,800 over eight and a half years, a 6.3% annual return. Bitcoin buy-and-hold turned the same $10,000 into roughly $1.08 million. Comparing those two lines directly is lopsided by construction, because the trend strategy deliberately held a small fraction of Bitcoin’s exposure. The like-for-like comparison is the green line: the same three coins, equal risk weights, the same 10% volatility target, and no trend signal. That naive vol-managed portfolio ended near $28,100 with a higher Sharpe ratio (1.24 versus 0.79). In this sample, on a risk-adjusted basis, the trend signal’s directional calls did not pay for their turnover against the simplest volatility-managed alternative.
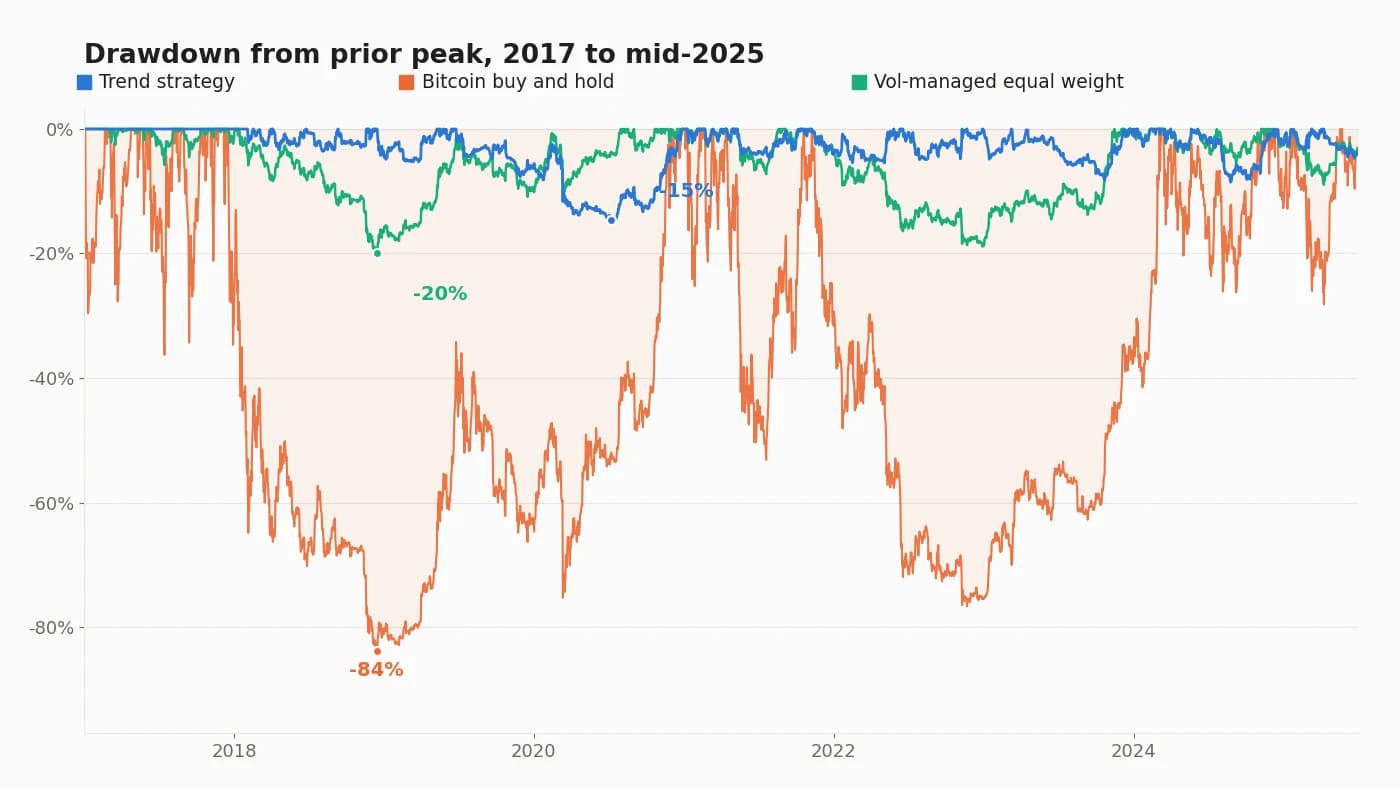
Drawdown from prior peak for the same three portfolios and window. Dots mark each portfolio’s deepest loss.
The drawdown chart is where trend following earns its keep, and where the increment over plain volatility management shows up. The trend strategy’s worst peak-to-trough loss in this window was about 15%, against 20% for the vol-managed portfolio and 84% for Bitcoin alone. A summary of the full comparison:
| Portfolio | CAGR | Volatility | Sharpe | Max drawdown |
|---|---|---|---|---|
| Trend strategy (1/3/12-month, long/short) | 6.3% | 8.1% | 0.79 | -14.6% |
| Bitcoin buy and hold | 73.5% | 71.5% | 1.13 | -83.8% |
| Vol-managed equal weight (no trend signal) | 12.9% | 10.2% | 1.24 | -19.9% |
| 200-day long/flat rule on Bitcoin only | 6.2% | 7.0% | 0.89 | -10.4% |
Same test as above: Coinbase daily closes, 2017 through June 2025, trend rows net of estimated costs, both trend rows scaled to roughly a 10% volatility target. One sample; treat every figure as an illustration of behavior, never as an expected return.
Three more results from the same test are worth reporting because they cut in different directions. First, the boring 200-day long/flat rule on Bitcoin alone, the design most retail trend products use, posted a slightly better Sharpe ratio and a shallower drawdown than the diversified multi-horizon ensemble. Complexity did not pay in this sample. Second, the trend signal did carry genuine information: when I re-ran the strategy with every possible combination of flipped position signs, the real signal beat all seven alternatives, and delaying every trade by five days cut the Sharpe ratio from 0.79 to 0.60, which is the decay pattern you expect from a real but modest effect. Third, the uncertainty is enormous: a bootstrap confidence interval around the strategy’s Sharpe ratio spans roughly 0.1 to 1.5. Eight and a half years of data cannot tell you whether crypto trend following is mediocre or excellent, and anyone quoting a crypto backtest without an interval that wide is overstating what they know.
Five ways crypto backtests fool their own authors
Each of the following is a defect I hit while building the open-source backtesting engine behind the test above. None is hypothetical, and every one of them inflates results silently.
1. Survivorship in the universe. Running today’s top ten coins backward through history tests a portfolio of confirmed winners. Thousands of coins that existed in 2017 went to zero and do not appear in today’s rankings. An honest backtest admits coins only through a point-in-time rule, such as a year of trading history before the first position, and accepts that the early years hold only one or two names.
2. The trading-calendar error. Stock tools assume 252 trading days per year. Crypto trades all 365. Annualizing crypto volatility with a 252-day convention understates it by about 17%, which overstates Sharpe ratios and undersizes risk estimates by the same factor. Any tool that was built for equities and pointed at crypto without recalibration makes this error.
3. Holes in the price history. Real exchange data has gaps. XRP, for example, has a 905-day hole on a major US exchange between January 2021 and July 2023, when the venue suspended trading during the SEC lawsuit. The default behavior of most data pipelines is to fill gaps forward, which manufactures two and a half years of perfectly flat prices. A trend rule reads a flat stretch as a genuine absence of trend and calmly holds through a period when it could not have traded at all.
4. Cost models that do not scale. Crypto prices span five orders of magnitude, from Bitcoin near $100,000 to coins under a dollar, so any cost model built on fixed per-unit assumptions misprices most of the universe. In an early version of the engine behind this article, a plausible-looking cost configuration was so miscalibrated that quadrupling every cost changed annual returns by just 0.07 percentage points at nine times annual turnover. The strategy looked nearly free to trade. It was not; the model was broken. Costs must be proportional to traded value, and any backtest that survives only at exactly its assumed costs is a cost assumption wearing a Sharpe ratio.
5. Lookahead you cannot see. Trading today on a signal computed from today’s close is the form everyone checks for. The versions that survive review hide in plumbing: volatility estimators that fill their warm-up period with information from the future, eligibility rules evaluated with knowledge of later listings, benchmarks that quietly rebalance daily while being labeled buy-and-hold. I found versions of all three in code I had reviewed and tested. The only reliable defense is adversarial: delay the signals, randomize the signs, multiply the costs, and check whether the result survives.
What you can actually buy today
The gap between the research and the product shelf is wide. The academic literature describes diversified long-short portfolios across many markets. The investable crypto trend products are mostly single-asset long/flat rules. Global X’s BTRN follows the CoinDesk Bitcoin Trend Indicator, holding CME Bitcoin futures when the trend reads positive and Treasuries when it does not.9 Bitwise ran a similar long/flat rotation across Bitcoin and Ether, BTOP, and liquidated it in May 2026.10 WisdomTree’s managed-futures ETF, WTMF, caps its bitcoin sleeve at 10% of assets, with its momentum model deciding whether to hold a long position at all.11 No US-listed product currently runs a diversified long-short crypto trend program of the kind the literature describes, even though CME now lists futures on nine tokens trading around the clock.12 For a DIY investor, that means implementing the research version yourself, with all five traps above, or accepting that the buyable version is a simpler long/flat rule on one or two coins. In the test above, the simpler version gave up little, which softens the blow.
When a crypto trend rule is the wrong tool
When your crypto sleeve is already small. Our crypto allocation guide argues that 0% is defensible and 1% to 2% is plenty for most people who want exposure. At that size, timing rules move portfolio outcomes by basis points; the sizing decision already did the risk management. Adding a trend overlay to a 1% position is complexity without consequence.
In a taxable account. The strategy in the test above turned over roughly 7 to 8 times its value per year. Nearly every gain a trend rule realizes is short-term, taxed as ordinary income, and crypto trades do not currently enjoy the futures tax treatment that conventional managed-futures funds use. A rule that survives cost stress in a backtest can still lose to buy-and-hold after taxes in a brokerage account.
When you will not hold through the tracking error. In the test window above, the trend strategy returned 6.3% annually while Bitcoin returned 73.5%. A real person running that strategy through 2020 and 2021 would have watched buy-and-hold neighbors make twenty times their return, for years. Abandoning a trend rule mid-drawdown or mid-mania converts its long-run properties into realized underperformance. The behavioral prerequisite is the same one our managed-futures guide describes, and it is harsher in crypto because the foregone gains are larger.
When what you want is crash insurance. Trend rules exit after prices fall, not before. They protect against the long grinding drawdowns of 2018 and 2022, and they lose to buy-and-hold in V-shaped crashes that recover within weeks. Our guide on missing the market’s best days covers why the distinction matters.
Test it before you trust it
The testing standard above is available as working code. The numbers in this article come from Engineer Investor’s open-source tf-trend package, a Python backtesting engine whose crypto extension implements the published academic strategies with the plumbing crypto requires: a 365-day calendar, point-in-time universe eligibility, proportional cost models, and strict handling of data gaps.13 Its distinguishing feature is a falsification command that attacks whatever strategy you configure:
pip install "tf-trend[crypto] @ git+https://github.com/engineerinvestor/systematic-trend-following-with-managed-futures.git"
tf crypto falsify --config configs/crypto/tsmom_1_3_12.yaml
One command produces the comparisons this article is built on: the strategy against buy-and-hold, vol-managed, and single-horizon benchmarks; the trend-versus-volatility-scaling decomposition; the same strategy with signals delayed by one, two, and five days; costs at two and four times the configured estimates; the portfolio with each coin removed in turn; and a placebo test that randomizes the direction of every position. The report also states when its own tests cannot bite, for example when configured costs are too small to matter. The package is MIT-licensed, ships no market data, and is deliberately hostile to its own results: the falsification report exists so that a broken assumption surfaces in your terminal instead of in your portfolio.
Disclosure: I write both Summitward and the Engineer Investor account, and I maintain the open-source package described above. It is free, and nothing in this section earns Summitward or the author anything.
Key takeaways
- The academic case for momentum in crypto is real but young. Peer-reviewed work finds time-series momentum in cryptocurrency returns, and momentum prices the crypto cross-section. The usable record is roughly a decade, against 140 years for conventional trend following.
- In the 2017 to mid-2025 test above, trend following reshaped risk far more than it added return. The strategy’s worst loss was about 15% against 84% for Bitcoin buy-and-hold, but a volatility-managed portfolio with no trend signal captured most of that improvement and posted a higher Sharpe ratio.
- Volatility scaling deserves most of the credit. Decomposed, the trend signal added about 0.05 of Sharpe and two points of drawdown on top of what volatility management alone delivered in that sample, consistent with the published critique of time-series momentum.
- Simple survived; complex did not earn its keep. A 200-day long/flat rule on Bitcoin alone matched the diversified multi-horizon ensemble in that sample, with a shallower drawdown.
- Crypto backtests fail in five characteristic ways: survivorship universes, the 252-day calendar error, forward-filled data holes, cost models that do not scale with traded value, and hidden lookahead. Test against all five before believing any result, including ours.
How Summitward helps
Stress-test the sequence, not just the average
Run your own portfolio mix through a century of historical return sequences to see how drawdowns, not averages, decide whether a plan survives.
Open the backtesting toolFrequently asked questions
Is crypto momentum the same as stock momentum?
No. Stock momentum in the academic literature is usually cross-sectional: buy recent winners, short recent losers, relative to each other. Trend following is time-series: each asset is compared only to its own past. Crypto research finds both effects, but the strategies in this guide, and every buyable crypto trend product, are time-series rules.
Should a crypto trend rule go long/short or long/flat?
The evidence does not settle it. The classical futures literature is long/short, but crypto’s upward drift, expensive borrow, and violent squeezes make shorting costly. In our single test, the short side contributed almost nothing to eight and a half years of profit in that sample. Every buyable product chose long/flat. Treat long/short as the research configuration and long/flat as the implementable one, and test both.
Is Bitcoin alone enough, or do I need a basket?
Man Group’s research finds diversification benefits growing to roughly 10 to 15 coins before costs dominate, but liquidity outside the top few names is thin, and in the test above the Bitcoin-only 200-day rule matched the three-coin ensemble. Diversification across coins helped less in that sample than diversification across signal horizons is usually assumed to help. Start with the major coins or do not start at all.
Why not use RSI, MACD, or a machine-learning model instead?
Because you cannot tell whether their backtests are skill or curve-fitting. The strategies in this guide have published, pre-crypto definitions: the parameters were fixed by academics years before the test data existed, which makes overfitting to crypto history impossible by construction. An indicator tuned until the Bitcoin backtest looked good has no such defense. Add complexity only after it survives the same delayed-signal, doubled-cost, randomized-sign battery the simple rules were subjected to.
How much history is enough to trust a crypto backtest?
More than exists. The eight-and-a-half-year test above produced a Sharpe confidence interval from roughly 0.1 to 1.5, which spans “barely positive” to “exceptional.” An interval that wide is the correct amount of humility for the sample size. Use crypto backtests to understand a strategy’s behavior, its drawdown shape, turnover, and failure modes, rather than to estimate its future return.
Related guides
- Do You Need Managed Futures? An Evidence-Based Look at Trend Following: the century of general evidence, the fund menu, and who should and should not use trend strategies.
- Should You Invest in Cryptocurrency?: the allocation decision that matters more than any timing rule, with a risk-budget calculator.
- Missing the Market’s Best Days: what trend rules do with the market’s tails, and why they are not crash insurance.
- Perpetual Futures: the funding and liquidation mechanics of the instruments most crypto traders would use for margin or short exposure.
- The Engineer’s Guide to Systematic Investing: the process discipline that separates a rule you follow from a rule you abandon.
Sources
- Moskowitz, T., Ooi, Y.H., & Pedersen, L.H. (2012). Time Series Momentum. Journal of Financial Economics, 104(2).
- Hurst, B., Ooi, Y.H., & Pedersen, L.H. (2013). Demystifying Managed Futures. Journal of Investment Management, 11(3).
- ReSolve Asset Management. How to Replicate Trend Following Managed Futures.
- Hurst, B., Ooi, Y.H., & Pedersen, L.H. (2017). A Century of Evidence on Trend-Following Investing. Journal of Portfolio Management, 44(1).
- Liu, Y., & Tsyvinski, A. (2021). Risks and Returns of Cryptocurrency. Review of Financial Studies, 34(6).
- Liu, Y., Tsyvinski, A., & Wu, X. (2022). Common Risk Factors in Cryptocurrency. Journal of Finance, 77(2).
- Man Group. In Crypto We Trend.
- Kim, A.Y., Tse, Y., & Wald, J.K. (2016). Time Series Momentum and Volatility Scaling. Journal of Financial Markets, 30.
- Global X ETFs. Bitcoin Trend Strategy ETF (BTRN).
- Bitwise Asset Management (2026). Bitwise Announces Updates to ETF Lineup.
- WisdomTree. Managed Futures Strategy Fund (WTMF).
- CME Group (2026). CME Group to Continue Expansion of Regulated Crypto Suite.
- Engineer Investor. tf-trend: systematic trend-following research engine (source of all backtest figures in this article; configuration and data window stated in the text).
Author disclosure
I write both Summitward and the Engineer Investor account, and I maintain the open-source tf-trend package used to produce the backtest figures in this article. The package is free and MIT-licensed. This guide is descriptive, not promotional; nothing here is a recommendation to buy, sell, or hold any asset or fund. All backtest figures are net of estimated costs, come from a single historical sample, and are not expected returns.
More in Investing & Portfolio
Browse all investing & portfolio guidesGet new guides by email
Evidence-based, no jargon. At most two emails a month. Unsubscribe any time.
Try it in Summitward
See historical backtesting in action with your own financial data. Free to start, no credit card required.