

Austria's 100-Year Bond: What Actually Happens If You Hold It to Maturity
The famous 75% loss is measured from the 2020 peak. What the math says about duration, convexity, and actually holding a century bond through to 2120.
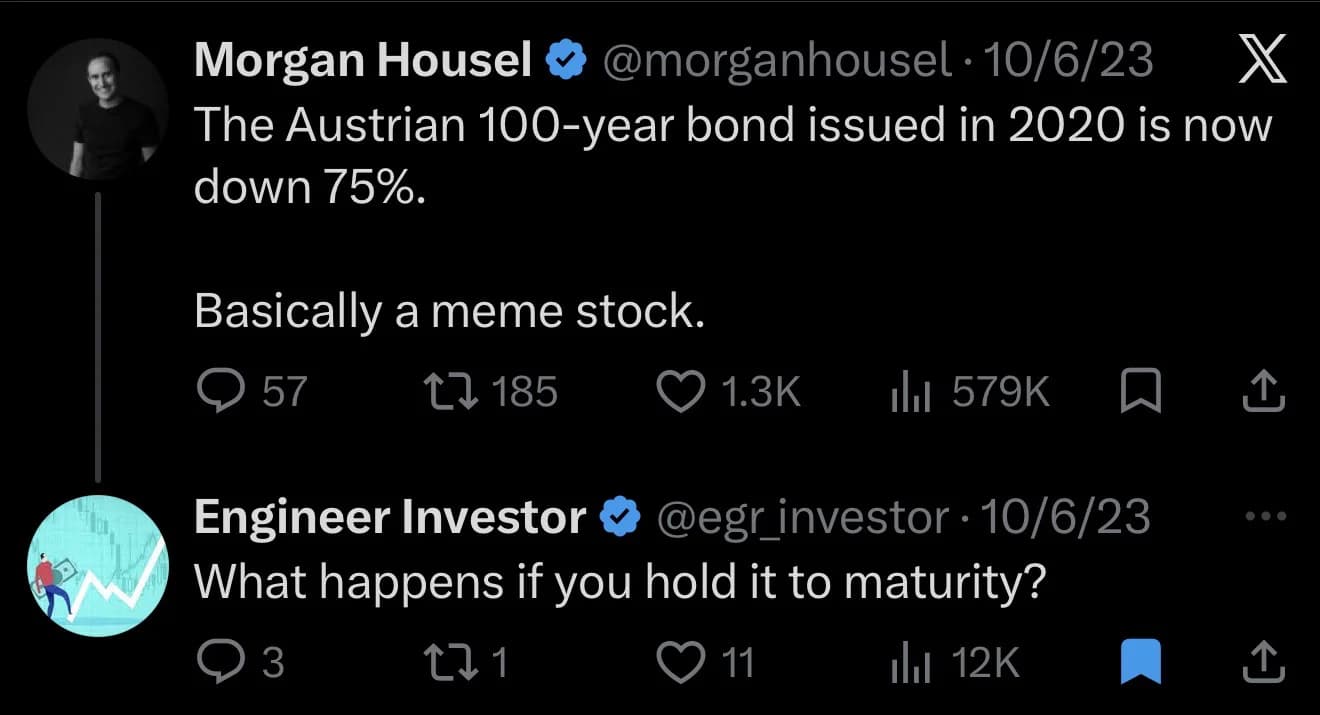
Morgan Housel on X, October 6, 2023, and my reply from the same day. Disclosure: I write both Summitward and the Engineer Investor account.
I asked that question in 2023 and never actually answered it. It has a number, the number is unpleasant, and it is not the number most people would guess.
Buy Austria’s 0.85% bond due 2120 at issue and hold it for a century and you will receive every promised euro. At the European Central Bank’s own 2% inflation target, that is a real return of roughly negative 1.1% per year, for a hundred years, and the 100 you get back in 2120 buys what about 14 buys today. Holding to maturity converts a mark-to-market loss into a slow, contractually guaranteed loss of purchasing power. It does not undo it.
The short version
The famous “down 75%” figure was a peak-to-trough drawdown, not a return since issue. Someone who bought at the June 2020 syndication was down about 65% when that was written, not 75%, because the bond had already run up 38% above its issue price before it fell. The price collapse itself is ordinary discounting arithmetic: the yield went from 0.88% to about 3.3%. What is not ordinary is the duration. At issue this bond had a modified duration near 67, and the standard rule of thumb for converting duration into a price move fails so completely at that level that it predicts losses beyond 100%. Meanwhile the same math says the bond is a better proposition today, near its all-time low, than it was when the order book was twelve times oversubscribed.
What Austria sold
On June 24, 2020, Austria priced 2 billion euros of a bond maturing June 30, 2120. The coupon was 0.85%, the issue price was 98.010, and the yield to the buyer was 0.880% per year. Austria’s federal financing agency described the deal as twelve times oversubscribed and called it the highest demand ever recorded for an Austrian government bond.1 Bloomberg reported more than 17.7 billion euros of final orders, which on a 2 billion euro deal is closer to nine times.2 Order books shrink between the peak of demand and final pricing, so both can be true at different moments, and the sensible reading is that this was one of the most heavily bid deals Austria has ever done.
It was not even the first one. Austria sold a 2.10% bond due September 2117 back in 2017, at an issue price of 99.502 and a yield of 2.112%.3 That bond matters later, because the difference between the two is the cleanest illustration in this whole story of what drives the risk.
Austria has kept selling the 2120 bond ever since. A tap on April 15, 2026 took the total outstanding to exactly 6.1 billion euros, and it cleared at a price of 29.922 for a yield of 3.237%.4 Read that twice. Austria is still issuing this bond, at thirty cents on the euro, and investors are still buying it.
From the issuer’s side the transaction is not a close call. Austria locked in fixed euro funding for a century at under 1%, owes 0.85 per year for every 100 of face value, does not refinance the principal until 2120, and watches inflation erode the real burden of every payment. Higher rates since 2020 have made that debt look better, not worse, because the contractual coupon never moves. The only reasonable criticism is that a debt manager balances interest cost against refinancing risk and maturity profile rather than simply borrowing as long as possible, and that nobody in 2020 knew rates would not go lower still. Judged on what was knowable at the time, borrowing for a hundred years at 0.88% is difficult to call a mistake.
Where the 75% came from
Here is the part that gets repeated wrong, including by me when I first read it.
The bond did not fall 75% from its issue price. It rose first. Austria transacted a tap on December 11, 2020 at a price of 135.233, a yield of 0.417%.4 Market highs that week reached roughly 137. Five months after issue, a bond sold at 98 was worth about 137.
By early October 2023, when the post above was written, it was trading near 34. Measured from that December 2020 peak, that is almost exactly 75%. Measured from the 98.010 issue price, it is about 65%. Both are large. They are not the same claim, and “the bond issued in 2020 is now down 75%” reads like the second while describing the first.
| Measured from | To October 2023 (~34) | To July 2026 (~29.5) |
|---|---|---|
| Issue price, 98.010 | about -65% | about -70% |
| December 2020 peak, ~137 | about -75% | about -78% |
The other thing worth updating: October 2023 was not the bottom. The bond closed at 29.510 on the Vienna exchange on July 28, 2026, and its low over the preceding year was 29.02.5 It is trading at or near the worst level it has ever seen, right now, three years after it became a punchline.
Why a AAA bond lost seventy percent
Nothing exotic happened. A bond’s price is the present value of its cash flows:
where is the annual coupon, the redemption amount, the market yield, and the years remaining. Raise and every future payment is discounted harder. Payments a long way out are discounted very much harder, because the discount factor compounds.
Put 0.85 and 94 remaining years into that expression and solve for the yield that produces a price of 29.70, and you get 3.26%. That is the entire story. Austria’s creditworthiness never came into question. Nobody panicked about default. A yield moved from 0.88% to a bit over 3%, and 70% of the price went with it.
The mechanics of duration, meaning the present-value-weighted average time to receive a bond’s cash flows, are worked through in the asset-liability matching guide. What is worth adding here is what happens to those standard tools when you push the maturity to a hundred years, because they stop working.
The duration rule breaks at this maturity
Every introduction to bonds teaches the same approximation. Modified duration times the yield change gives the percentage price move:
A fund with a duration of 7 loses about 7% when yields rise a point. That is a good rule at ordinary maturities. It is a disaster here.
At issue, this bond had a Macaulay duration of 67.4 years and a modified duration of 66.8. Not the 50-ish figure that gets quoted, and nowhere near a normal long bond. Apply the rule to a two-percentage-point yield rise and it predicts a loss of 133.6%. A bond cannot lose more than everything. The actual answer was a 65.7% decline.
The missing piece is convexity, the second-order term. Price is a curved function of yield, and duration is only its slope at one point. The curvature is enormous at long maturities: convexity was about 5,750 at issue, against roughly 50 for a ten-year Treasury. Once you include it, the estimate improves, and then it too falls apart as the yield move gets bigger.
| Yield rise from 0.88% | Actual | Duration only | Duration + convexity |
|---|---|---|---|
| +0.25 points | -15.0% | -16.7% | -14.9% |
| +1.00 points | -45.2% | -66.8% | -38.0% |
| +2.00 points | -65.7% | -133.6% | -18.5% |
Both approximations are Taylor expansions, and Taylor expansions are local. At 67 years of duration they stop being informative well before the yield move gets interesting. For a bond this long there is no shortcut. You have to discount the cash flows.
Duration falls as yields rise, which is why the bleeding slowed
The same curvature has a consequence that reads as good news. Duration is not a constant. As the yield rose, the present value of the distant principal shrank relative to the nearer coupons, and the bond’s effective duration came down with it.
| Yield | Price | Modified duration | Convexity | |
|---|---|---|---|---|
| December 2020 peak | 0.42% | ~135 | 72.6 | 6,450 |
| At issue, June 2020 | 0.88% | 98.01 | 66.8 | 5,753 |
| July 2026 | 3.26% | 29.70 | 36.7 | 2,353 |
Modified duration nearly halved, and only six of the ninety-four years of decline came from the calendar. The rest was pure repricing. Each additional point of yield now does substantially less proportional damage than the last one did. From today’s starting point a further two-point rise costs about 43%, where the duration rule would claim 73%.
The label says maturity. The risk is in the coupon
The 2017 bond makes the mechanism unmistakable. Same issuer, essentially the same maturity, but a 2.10% coupon instead of 0.85%. That larger coupon pulls present value forward and gives it a modified duration of 41.5 at issue rather than 66.8. It trades at 56.4 today against the 2120 bond’s 29.5.5 A low coupon is most of the risk.
Take four hundred-year bonds, each issued at par, and the only thing that differs is the coupon:
| Coupon on a 100-year bond at par | Macaulay duration |
|---|---|
| 0.85% (Austria 2120) | 67.8 years |
| 2.10% (Austria 2117) | 42.5 years |
| 5.00% | 20.8 years |
| 7.55% (Disney, 1993) | 14.2 years |
Disney sold a hundred-year bond in 1993 at 7.55%, and its duration was 14.2 years. A thirty-year bond at the same yield has a duration of 12.6. Two instruments whose stated maturities differ by seventy years were within a year and a half of each other in interest-rate risk. The 1993 vintage of century bond and the 2020 vintage share a label and almost nothing else. “Hundred-year bond” tells you when the principal is scheduled to arrive, which turns out to be one of the less interesting facts about it.
What actually happens if you hold to maturity
Now the original question. Suppose you bought at issue in 2020, you never sell, Austria pays everything it owes, and you collect the final 100 in June 2120.
Contractually, you are fine. You get 85 in total coupons across a century plus 100 at redemption. Nothing was lost in the sense of a payment being missed.
Economically, you locked in 0.88% per year in nominal terms for a hundred years, and the real outcome depends entirely on inflation:
| Average inflation | Real return per year | What the final 100 buys in 2020 money |
|---|---|---|
| 0% | +0.88% | 100 |
| 1% | -0.12% | 37 |
| 2% (the ECB target) | -1.10% | 14 |
| 3% | -2.06% | 5 |
If the ECB hits its target for a century, the buyer at issue loses about 1.1% of purchasing power every year for a hundred years and receives a principal repayment worth about 14 cents on the euro in the money they originally lent. That is the deal they signed.
Vanguard puts the general version of this bluntly in its own research, under the heading that holding an individual bond to maturity may provide no economic benefit: whether you sell a bond before maturity and reinvest, or hold it and reinvest the proceeds, the yield profile is similar, and the comfort of watching the principal come back is “primarily an emotional rather than economic benefit.”6 The maturity date changes when you find out, not what you earned.
Which is why both stock arguments about this bond are incomplete. “It fell 75%, therefore it was absurd” ignores that the contractual return was never in doubt. “Hold it to maturity and the loss does not matter” ignores that holding to maturity is how you guarantee the loss instead of merely marking it. Holding changes which loss you take. It does not remove the opportunity cost of having committed capital at 0.88% while the world repriced to 3%, and it does nothing about inflation.
What became of the other century bonds
Austria’s is not the only one, and the others fill in the risks that a AAA sovereign happens to leave out.
Argentina, 2117. In June 2017, fourteen months after emerging from its previous default, Argentina sold a hundred-year bond. The coupon was 7.125%, it priced at 90 for a yield of 7.917%, and the order book reached 9.75 billion dollars against 2.75 billion authorized. It paid five semiannual coupons. On June 28, 2020, exactly three years to the day from settlement, Argentina failed to make the payment due, which it later stated plainly in its own filings.7 Holders received 97 dollars of new 2035 or 2046 bonds per 100 of face value in the restructuring that September. The instrument that was supposed to last a century lasted three years.
That is the risk Austria genuinely does not carry, and it is worth naming rather than assuming away. Over a hundred-year horizon, “this government will still be paying” is a real assumption, not a free one. Buying duration and buying credit are separate decisions, and a century bond makes you take a hundred-year view on both.
Disney, 2093. The famous “Sleeping Beauty” bond, issued 1993 at 7.55%, was callable after thirty years. Disney redeemed it on July 15, 2023, the first date it was permitted to.8 Coca-Cola sold a nearly identical century bond a day later at 7.375%, made it non-callable, and it is still outstanding. The lesson is about who holds the option. A callable century bond is a century bond only while that suits the issuer, which is precisely when it suits you least.
British consols. The longest-running natural experiment available. Undated gilts paying 2.5% and 4% survived from the nineteenth century until the UK Treasury finally redeemed them in 2015.9 Holders through the twentieth century did not do well. The Bank of England’s consol yield series peaked at 17.05% in December 1974, which puts a 2.5% perpetual at under 15 per 100 of face. Reinvesting every coupon from 1946 to 1974 left a holder down 78% in real terms, and down in nominal money too. Nobody defaulted on them. Inflation did the work.
Who had a real reason to own it

My reply to the same thread, July 2026.
I still think that is broadly right, and one clause in it is wrong.
The defensible case is a pension fund or life insurer with long-dated, fixed, euro-denominated obligations. When yields rise, the present value of those obligations falls too. An institution measuring its funding ratio rather than its bond’s standalone price can watch an asset drop 70% and see very little change in the gap between what it owns and what it owes. That is the entire logic of duration matching, and long sovereign bonds are one of the few instruments with enough duration to offset liabilities stretching decades out.
The clause I would take back is “or endowment.” Endowments do have multi-generational horizons, but their obligations are almost entirely real: supporting a spending rule, funding salaries and operations that rise with prices, preserving purchasing power across generations. A nominal bond is a poor hedge for a real liability. That is the distinction Campbell, Shiller and Viceira draw directly, writing that because expected inflation varies over time, conventional nominal bonds are not safe in real terms, and that inflation-indexed bonds fill that gap by offering a genuinely riskless long-term investment.10
Their qualifier deserves as much attention as the claim. In the same paper they note that if the breakeven inflation rate is constant, because a central bank has achieved complete anti-inflationary credibility, then nominal bonds become perfect substitutes for indexed bonds and conventional government debt suits conservative long-term investors fine.10 A long nominal bond suits a long horizon exactly to the extent that inflation over that horizon is predictable. Over a hundred years, that is not very far.
A pension with fixed nominal euro payments in 2075: reasonable. An endowment funding real spending forever: reach for index-linked instruments instead. Anyone else, as I originally put it, was making a discretionary bet on the direction of long-term yields, which is a legitimate thing to do as long as it is called that.
When the hedge becomes the hazard
Duration matching is sound. Duration matching financed with leverage is a different animal, and the United Kingdom demonstrated the difference in 2022.
UK defined-benefit schemes used liability-driven investment strategies, with more than a trillion pounds invested in them, to obtain long-duration exposure through repo and swaps while keeping capital free for return-seeking assets. When gilt yields spiked after the September 2022 mini-budget, those positions took collateral calls. Meeting the calls meant selling gilts, which pushed yields higher, which triggered more calls. The Bank of England’s own description is that distressed forced selling by LDI funds produced fire-sale dynamics and an adverse feedback loop.11 Thirty-year gilt yields rose 130 basis points in three trading days, a move the Bank described as three times larger than any comparable historical move.
On September 28, 2022 the Bank announced temporary purchases of conventional gilts with more than twenty years residual maturity, initially up to 5 billion pounds per auction, extending to index-linked gilts on October 11 and ending October 14.12 Two details usually get lost. The Bank never announced a total size; the 65 billion figure that circulates is arithmetic applied after the fact to the daily cap. And it did not spend anything close to that, buying 19.3 billion pounds in the end, because it priced its purchases as a backstop rather than a bid.11 The IMF’s assessment identified the familiar triad of leverage, a liquidity shortage, and interconnectedness.13
Duration matching came through the episode intact. What the episode showed is that an instrument can hedge one risk while introducing another. A century bond can reduce your exposure to falling reinvestment rates while raising your exposure to inflation, liquidity, currency, and, if you finance it, margin.
Does the market portfolio say you should own it?
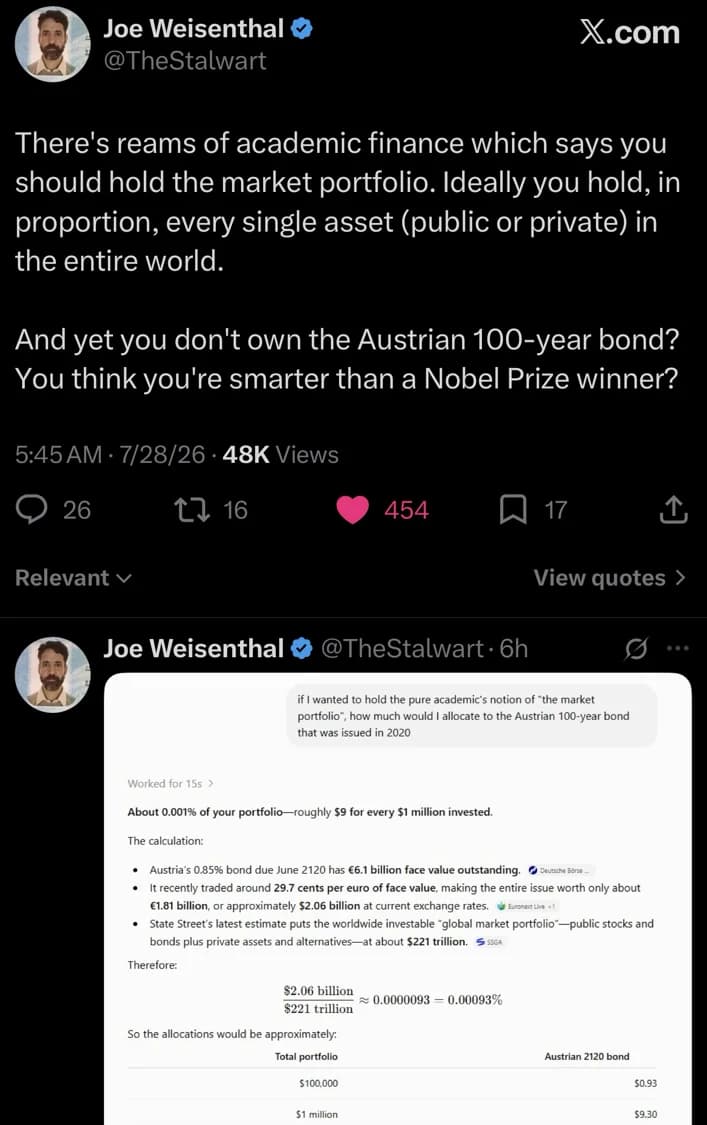
Joe Weisenthal on X, July 28, 2026. The figures in the attached screenshot are an AI-assisted calculation; the check below is mine.
The joke is good and the arithmetic in it holds up. Austria has 6.1 billion euros of face value outstanding, it trades near 29.7, so the whole issue is worth about 1.81 billion euros, which at the ECB reference rate of 1.1367 dollars per euro on July 28, 2026 is roughly 2.06 billion dollars.14 State Street put the global investable market portfolio at 221 trillion dollars as of the end of March 2026.15 The quotient is 0.00093%, or about $9.30 per million dollars invested. I recomputed every step and it checks.
So the honest answer to “you think you’re smarter than a Nobel Prize winner?” is that market-cap logic prescribes a nine dollar position, which is indistinguishable from zero and would cost more than that to establish. The theory does not tell anyone to make a real allocation here.
The deeper problem is that nobody can hold the market portfolio anyway. Roll made the point in 1977 and it has never been answered: the theory is not testable unless the exact composition of the true market portfolio is known and used, and a chosen proxy can be efficient while the true portfolio is not, or the reverse.16 Every published estimate is a construction with a boundary drawn somewhere. State Street’s 221 trillion excludes cash, money-market instruments, and every commodity except gold. The standard academic estimate, from Doeswijk, Lam and Swinkels, put the global multi-asset market portfolio at 126 trillion dollars at the end of 2017 on a different definition.17 These are not competing measurements of one object.
And market-cap weighting was never the whole of the theory. Merton showed in 1973 that when the investment opportunity set moves over time, optimal demand splits into a myopic mean-variance piece plus a hedging piece: demand for assets that pay off precisely when opportunities deteriorate.18 The hedging term depends on the investor, not on what exists in the world. Two people with identical wealth and different liabilities, currencies, jobs, and tax situations should not hold the same portfolio, and no amount of aggregate market capitalization changes that.
What this means for a DIY investor
Almost nobody reading this has a reason to own an individual hundred-year bond. The useful part is the set of distinctions the episode makes vivid.
Credit risk and duration risk are unrelated. Austria is rated AA+ and has never looked like defaulting. That fact was worth nothing to someone who needed to sell in 2023. “Government bond” describes who pays you, not how the price behaves.
A long horizon is not a reason to buy long bonds. What matters is when you need the money and whether that need is nominal or inflation-linked. A 40-year-old has a long horizon and also has an emergency next year, possibly a house in five years, tuition in fifteen, and retirement spending across thirty. Those are several liabilities with different dates, not one hundred-year obligation. The asset-liability matching guide works through how to size that.
For inflation-linked needs, use inflation-linked bonds. Retirement spending rises with prices, which makes it a real liability, and the instrument built for real liabilities is TIPS. A TIPS ladder matches dated real cash flows in a way no nominal bond can.
Foreign bonds carry a second bet. A dollar-based investor buying this bond is exposed to euro rates and to the euro itself, and the second exposure is larger than the first. EUR/USD has run at about 9% annualized volatility since 1999, against roughly 5% for a euro government bond index in its own currency, so most of the variance a US investor would experience here is the exchange rate rather than the bond. Campbell, Serfaty-de Medeiros and Viceira found that the risk-minimizing currency strategy for a global bond investor is close to a full hedge, and that hedging currency reduces portfolio risk far more for bonds than for equities.19 Vanguard’s 2026 formulation of the same result is a single rule: hedge fixed income and leave equity unhedged.20
A nominal bond is not a recession hedge if the recession is inflationary. Long Treasuries earned their reputation in 2008 and in early 2020, and they deserve it in a deflationary shock. In 1973–74 the ten-year Treasury returned about 2.8% a year in nominal terms while equities fell, which reads like the hedge working, except that inflation ran at 10.5% a year. Bondholders lost roughly 7% a year of purchasing power during a recession. Which risk a bond hedges is the subject of the diversifier-or-hedge guide, and the short answer is that it depends on whether the trouble is growth or prices.
Know your duration before you reach for yield. Or, in 2020, before you reach for the absence of yield. Buying a 0.85% bond made no sense as an income decision. It only made sense as a bet that yields would keep falling, which is a macro trade wearing a government bond’s clothing.
The bond is a better proposition now than it was then
Run the same arithmetic on today’s price. At 29.7, the yield to maturity is about 3.26%. At 2% inflation that is +1.24% real per year, against the -1.10% real locked in by the buyer at issue. On the metric that matters for a long-horizon holder, this bond is roughly two and a third percentage points a year better than it was when it was twelve times oversubscribed.
Austria’s April 2026 tap found buyers at 29.922 without difficulty. They are being paid three times the yield for a claim on the same government, with a third of the duration, at a price that has already absorbed the repricing everyone is laughing about.
The instrument never changed. It has the same issuer, the same coupon, the same maturity date it had in 2020. What changed is the price, and the price is what determines whether a bond is a good idea. The right criticism of the 2020 buyers is about the price they paid. They committed capital for a hundred years at 0.88%.
Frequently asked questions
Did the Austrian 100-year bond really fall 75%?
From its December 2020 peak of roughly 137, yes, and by July 2026 the drawdown from that peak is closer to 78%. From the 98.010 issue price it is about 70%. The commonly repeated 75% was measured from the peak, five months after issue, not from what buyers actually paid at the syndication.
What return do you get if you hold it to maturity?
Exactly the yield you bought at, assuming Austria pays and you can reinvest coupons at that rate. A 2020 buyer locked in 0.880% nominal for a century, which is about -1.1% per year in real terms if inflation averages the ECB’s 2% target. A buyer today at roughly 3.26% locks in about +1.24% real on the same assumption.
Why did the price fall so much more than a normal government bond?
Duration. A 0.85% coupon over a hundred years places most of the bond’s value far in the future, giving it a modified duration near 67 at issue against roughly 8 for a ten-year Treasury. The yield moved about 2.4 percentage points, which is unremarkable, and the price response was not.
Is duration enough to estimate the loss on a very long bond?
No. The standard first-order rule predicts a 133% loss for a two-percentage-point yield rise on this bond, which is impossible. Even adding the convexity term leaves large errors at that size. For maturities this long the approximations break down and the cash flows have to be discounted directly, which is what the calculator above does.
Should a DIY investor ever own a century bond?
Rarely, and never as a substitute for thinking about the liability. Individual ultra-long bonds serve institutions with matching long-dated nominal obligations. For personal finance the same jobs are done better by T-bills and cash for near-term needs, Treasury ladders for dated nominal ones, TIPS for inflation-linked spending, and intermediate bond funds for general ballast.
Key takeaways
- The 75% was measured from the December 2020 peak. The bond rose 38% above its issue price before it fell. A buyer at the 2020 syndication was down about 65% when the meme started, and about 70% today.
- A 2.4-point yield move did all of it. From 0.88% to about 3.26%, with no change in Austria’s creditworthiness at any point.
- Modified duration was 66.8 at issue, not 50. And the familiar duration rule predicts a 133% loss for a two-point yield rise, which no bond can deliver. At this maturity you have to reprice the cash flows.
- Duration fell to about 37 as yields rose. Long bonds partially de-risk themselves on the way down, so each further yield increase hurts proportionally less than the last.
- Holding to maturity guarantees the loss rather than erasing it. At 2% inflation the 2020 buyer earns about -1.1% real per year for a century and gets back principal worth roughly 14 cents on the euro.
- The market-portfolio argument prescribes about $9 per $1 million. Which is to say it prescribes nothing, and personal portfolios are set by liabilities and horizon rather than by what exists in the world.
Related guides
- Asset-Liability Matching the duration math behind all of this, applied to a personal balance sheet rather than a pension fund.
- How to Build a TIPS Ladder the instrument for real spending obligations, which is what most retirement liabilities are.
- Does the Fed Really Set Interest Rates? where long yields come from, and why the long end is not controlled by the central bank.
- Are Bonds Still Good Diversifiers? what 2022 did to the stock-bond relationship, and which risk bonds actually hedge.
- The Risk Parity Reality Check what happens when long-duration exposure is obtained with leverage, which is the UK LDI story in portfolio form.
Sources
- Österreichische Bundesfinanzierungsagentur. Annual Review 2020. The 0.85% 2020-2120 bond, EUR 2.00 billion at a 0.88% yield, with twelve-fold oversubscription described as the highest demand for any Austrian government bond.
- Bloomberg, “Investors Get Less Than 1% Lending to This Nation for 100 Years”, June 24, 2020. Reported more than EUR 17.7 billion of orders.
- Österreichische Bundesfinanzierungsagentur. Annual Review 2017. The 2.10% 2017-2117 bond, EUR 3.5 billion at 99.502 for a 2.112% yield. Note the EUR 22 billion order book cited there covers a dual syndication of two bonds, not the century bond alone.
- Österreichische Bundesfinanzierungsagentur. Historical issuance of Austrian government bonds. Every auction and tap with price, yield, and cumulative outstanding. Source for the 135.233 print of December 11, 2020, the April 15, 2026 tap at 29.922 for a 3.237% yield, and the EUR 6.1 billion outstanding.
- Wiener Börse. AT0000A2HLC4 quote. Closing price 29.510 on July 28, 2026, with a 52-week low of 29.02. The 2117 bond (AT0000A1XML2) closed at 56.420 the same day.
- Plink, M. (2022). Rising rates beg the question: Bonds or bond funds? Vanguard Research. Source of the section heading “Holding an individual bond to maturity may provide no economic benefit to investors” and the emotional-versus-economic framing.
- Republic of Argentina. Prospectus supplement filed with the SEC, August 2020, SEC EDGAR: “on June 28, 2020, the Republic did not make interest payments due and payable on the USD 2117 Bonds.” Issue terms (7.125% coupon, 90 issue price, June 28, 2117 maturity) from the 2018 exhibit filingand Resolución Conjunta 97-E/2017.
- The Walt Disney Company. Form 8-K, June 12, 2023, SEC EDGAR. Redemption of the 7.55% Senior Debentures due July 15, 2093 on July 15, 2023, the first permitted call date.
- UK Debt Management Office. Press notices on the redemption of undated gilts, dmo.gov.uk. The 4% Consolidated Loan and 3½% War Loan were redeemed in early 2015; the remaining undated gilts followed in July 2015. Consol yields are from the Bank of England’s long-run series.
- Campbell, J. Y., Shiller, R. J., & Viceira, L. M. (2009). Understanding Inflation-Indexed Bond Markets. Brookings Papers on Economic Activity, Spring 2009, 79–120. Both the claim that nominal bonds are not safe in real terms and the qualifier that they become perfect substitutes for indexed bonds when the breakeven rate is constant. See also Campbell & Viceira, “Who Should Buy Long-Term Bonds?”, American Economic Review 91(1), 2001, 99–127, and their book Strategic Asset Allocation (Oxford University Press, 2002).
- Bank of England. Financial stability buy/sell tools: a gilt market case study, Quarterly Bulletin 2023. The fire-sale feedback loop, the 130 basis point three-day move in 30-year gilt yields, backstop pricing, and total purchases of GBP 19.3 billion.
- Bank of England. Market Notice, 28 September 2022. Temporary purchases of conventional gilts over 20 years residual maturity, initially up to GBP 5 billion per auction, with no announced aggregate. Extended to index-linked gilts on October 11, 2022.
- Chen, R., & Kemp, E. (2023). Putting Out the NBFIRE: Lessons from the UK’s Liability-Driven Investment (LDI) Crisis. IMF Working Paper 2023/210. Leverage, liquidity shortage, and interconnectedness as the shared mechanism.
- European Central Bank. Euro reference exchange rate, US dollar. 1.1367 dollars per euro on July 28, 2026.
- Dodard, F., & Le, A. (2026). Global Market Portfolio 2026: A portfolio of everything. State Street Investment Management. USD 221 trillion as of the end of March 2026, excluding cash, money-market instruments, and commodities other than gold.
- Roll, R. (1977). A critique of the asset pricing theory’s tests Part I. Journal of Financial Economics 4(2), 129–176. The theory is untestable unless the exact composition of the true market portfolio is known and used.
- Doeswijk, R., Lam, T., & Swinkels, L. (2020). Historical Returns of the Market Portfolio. Review of Asset Pricing Studies 10(3), 521–567. USD 126 trillion at year-end 2017.
- Merton, R. C. (1973). An Intertemporal Capital Asset Pricing Model. Econometrica 41(5), 867–887. Optimal demand splits into a myopic component and an intertemporal hedging component. The hedging term arises from risk aversion differing from log utility rather than from horizon length alone.
- Campbell, J. Y., Serfaty-de Medeiros, K., & Viceira, L. M. (2010). Global Currency Hedging. Journal of Finance 65(1), 87–121. The risk-minimizing currency strategy for a global bond investor is close to a full hedge, and the risk reduction from hedging is far larger for bonds than for equities.
- Baynes, L., & Aliaga-Díaz, R. (2026). The FX dimension: Evaluating currency hedging for global multi-asset portfolios. Vanguard Research: “Hedge fixed income and leave equity unhedged.”
Editor’s note
Educational content, not investment advice. Bond terms, prices, and yields were verified against the Austrian Treasury’s own issuance records and the Wiener Börse on July 28, 2026, and market prices move. All duration, convexity, and repricing figures were computed independently in Python and in the TypeScript that powers the calculator above, using annual coupons and annual compounding, and the two agree to the digits shown. Where a widely repeated figure conflicts with the primary source, the primary source is followed and the discrepancy is stated in the text.
More in Investing & Portfolio
Browse all investing & portfolio guidesGet new guides by email
Evidence-based, no jargon. At most two emails a month. Unsubscribe any time.
Try it in Summitward
See Monte Carlo retirement simulation in action with your own financial data. Free to start, no credit card required.