

How Much of Your Retirement Should Be a Guaranteed Income Floor?
Your funded ratio decides. For one modeled 65-year-old, a partial floor helped above 0.65x funded and hurt below it. How to size a guaranteed income floor.
Plenty of retirement writing explains how to build a guaranteed income floor. Far less of it answers the question that comes first: how much of your spending should be guaranteed at all? The usual answer is a risk tolerance questionnaire. There is a better one, and it starts with a price.
Flooring means moving some future spending off your portfolio and onto something contractual: a TIPS ladder, delayed Social Security, an annuity. Every dollar you floor is a dollar that stops depending on markets and also stops growing with them. Whether that trade helps or hurts turns almost entirely on one ratio, and the direction reverses depending on which side of it you are on.
Price the Liability Before Deciding How Much to Cover
Your funded ratio is your portfolio divided by what it would cost, today, to buy a full floor on your essential spending. The numerator is easy. The denominator is where most planning goes wrong, because it is usually a present value computed at an assumed return rather than a price you could pay.
Use a market price instead. At the Treasury real yield curve of August 13, 2026, a 30-year level TIPS ladder cost about $20.29 per dollar of annual real income, a real payout rate of 4.93%. Flooring $100,000 a year of essential spending for 30 years cost roughly $2.03 million that day. A household with $1.6 million was at 0.80x funded. One with $2.4 million was at 1.20x.
The difference between the market price and an assumed-return present value is not an accounting detail. It is precisely the investment return you are counting on but have not yet earned. Pricing at the curve makes that dependency explicit instead of burying it in a discount rate. The same logic drives the certainty-equivalent funded ratio applied to a whole balance sheet, and it is the reason asset-liability matching insists the discount rate belong to the liability rather than to the portfolio.
The Denominator Moves More Than the Numerator
Because the cost of a floor is a bond price, it swings with real yields. The same 30-year, $100,000-a-year liability priced at three different curves:
| Curve date | Cost per $1 of annual real income | Real payout rate |
|---|---|---|
| August 13, 2026 | 20.29x | 4.93% |
| October 2022 | 23.25x | 4.30% |
| August 2021 | 33.82x | 2.96% |
A household whose portfolio and spending never changed would have moved from roughly 0.72x funded in August 2021 to 1.20x in August 2026 on yield moves alone. Nothing about their finances improved. The price of the thing they were trying to buy fell by a third.
Two consequences follow. A funded ratio is a point-in-time reading, so recompute it rather than carrying last year’s number forward. And the decision to floor is partly a decision about when, which is uncomfortable but honest: buying a floor at deeply negative real yields is a materially worse deal than buying one at positive real yields.
What Counts as Ladderable Essential Spending
The denominator should cover essential spending only, and only the part that is not already guaranteed.
- Net inflation-indexed income first. Social Security is already CPI-indexed and already pooled for longevity. Flooring on top of it buys the same protection a second time. Subtract the expected real benefit and size the floor to the gap.
- Exclude discretionary spending. Travel and hobbies are the spending you would cut in a bad decade, which is exactly what makes them unsuitable for a guarantee.
- Exclude fixed nominal obligations. A mortgage payoff is a known dollar amount, not a known real amount. Funding it with an inflation-indexed bond introduces basis risk rather than removing it. A nominal Treasury matches it more cleanly.
- Watch spending that escalates faster than CPI. Healthcare has historically outrun the general index. A CPI-linked ladder underfunds a liability growing faster than CPI, so either escalate that line item explicitly or accept the basis risk knowingly.
Three Regimes From One Modeled Sweep
To see where flooring helps, hold everything constant and vary only the share of spending moved onto the ladder. For each level: price that partial floor at the live curve, carve its cost out of the portfolio, reduce portfolio spending by the floored amount, and re-simulate what remains.
The scenario below is one synthetic 65-year-old with a 30-year horizon and $100,000 a year of level real spending, all of it essential, priced at the August 13, 2026 curve. Ten thousand paths per level, which puts the standard error at about half a percentage point.
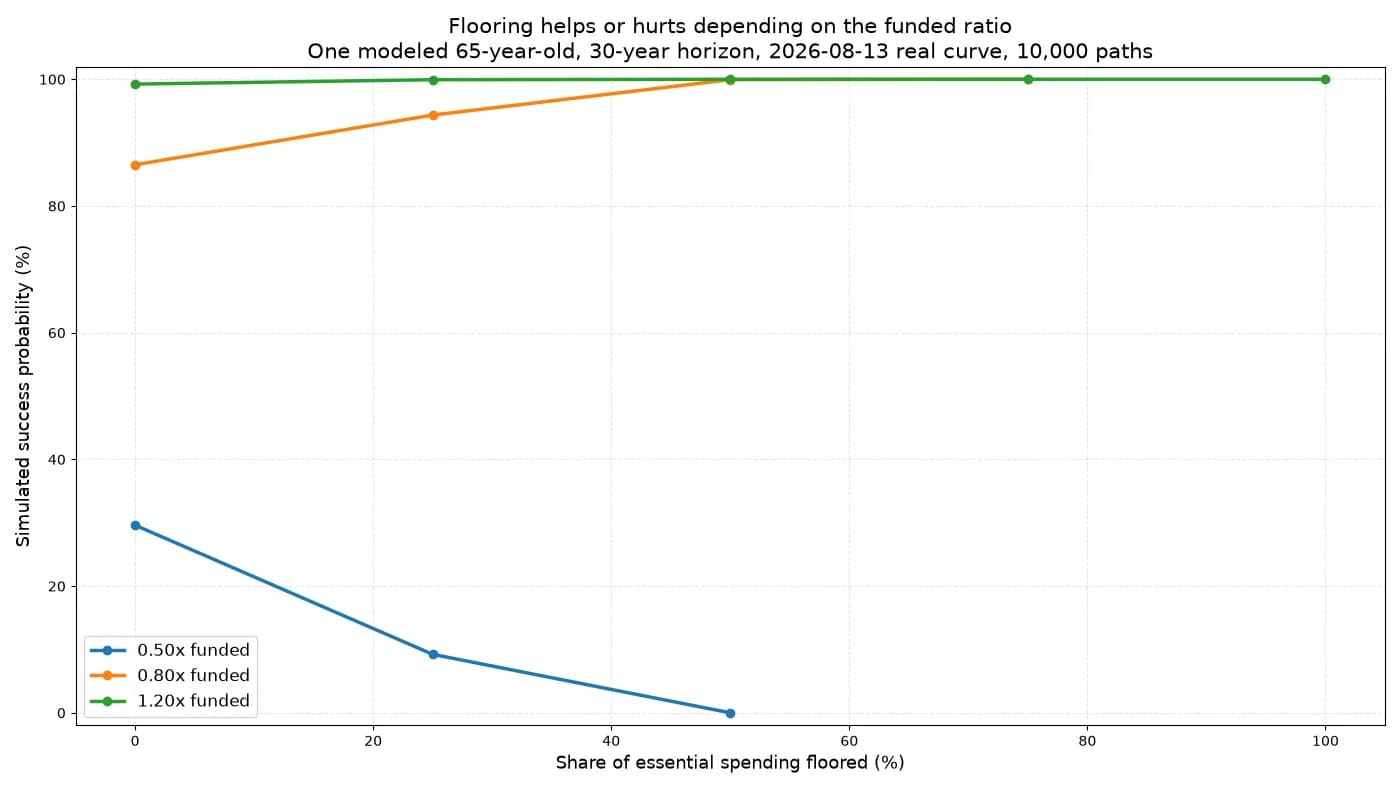
Simulated success probability by floor level for one modeled 65-year-old, 30-year horizon, level real spending, priced at the August 13, 2026 Treasury real curve. 10,000 paths per level, fixed seed. Reproduce with scripts/analyze_income_floor_regimes.py.
Three regimes, with all figures conditioned on that one scenario:
- Below roughly 0.65x funded, flooring lowered the odds. At 0.50x, moving from no floor to a 25% floor cut simulated success from 29.6% to 9.2%. At 0.62x the two were nearly tied. The crossover in this scenario sat near 0.63x.
- Between roughly 0.65x and 1.2x, flooring raised the odds. The gain was largest in the middle of the band: at 0.80x funded, a 25% floor moved simulated success from 86.5% to 94.4%, and a 50% floor to 99.9%. This is the band most retirees who are close but not certain occupy.
- Above roughly 1.2x, it stopped mattering for survival. At 1.20x every floor level cleared 99%, a spread of under a point and close to the simulation’s own resolution. The remaining argument is about variance, bequest, and peace of mind rather than about running out.
The thresholds are approximate boundaries from one scenario and one return model, not guardrails. They move with the curve, the horizon, and the return assumptions. What travels is the shape: a region where flooring hurts, a wide middle where it helps, and a top where it is close to free.
Why a Partial Floor Can Lower Your Odds
The underfunded result looks wrong at first. Buying a guarantee should make a plan safer.
It does, and that is the problem. A floor converts an uncertain claim into a certain one. When the certain amount is already below what you need, you have spent capital to remove the right tail of the distribution, and the right tail was the only region where the plan worked. A household at 0.50x funded does not have a volatility problem. It has a shortfall, and a strong market is the only mechanism in the model that closes it.
The arithmetic backs this up. At the August 13, 2026 curve the ladder paid 4.93% real. That is a ceiling on what floored dollars can produce. Locking dollars at 4.93% real is a fine outcome for a household that needs 4% and a losing one for a household that needs 9%, which is roughly what deep underfunding demands.
What the Simulation Assumes
The sweep runs on the same engine as Summitward’s retirement simulation: a multivariate normal return model over a global multi-asset portfolio, with 3% mean inflation. It is not a historical bootstrap of US stock returns, and it is not a claim about the future.
Three limitations worth holding onto:
- A multivariate normal understates tail risk relative to a block bootstrap of historical sequences. Real markets have fatter tails and more autocorrelation than the model gives them, which flatters unfloored portfolios slightly.
- Success probability is binary. It counts whether money ran out, not by how much or in which year. A plan that fails in year 29 and one that fails in year 3 score identically, and flooring changes the timing of failure as much as its frequency.
- Differences under about one percentage point at 10,000 paths are noise. The 0.80x result is far outside that. The 1.20x result is not, which is why the third regime is described as indifferent rather than as a win.
Cheaper Ways to Buy Real Income
A TIPS ladder is one way to floor spending, and it is rarely the first one worth using. Ranked by cost per dollar of guaranteed real income:
- Delayed Social Security. Each year of delay past full retirement age raises the benefit by 8% through age 70, per the Social Security Administration. The result is CPI-indexed, backed by the federal government, and pooled for longevity, which is a combination no purchasable product matches. For most households this is the cheapest real income available, and it shrinks the ladderable gap before you buy anything. Covered in when to claim Social Security.
- A TIPS ladder. 4.93% real at the August 13, 2026 curve, Treasury credit quality, fully transferable, and it leaves a remainder if you die early. It provides no longevity pooling past its last rung. Construction details are in how to build a TIPS ladder.
- An inflation-indexed annuity, if you can find one. US insurers largely stopped writing CPI-indexed immediate annuities after 2019. Products marketed as inflation protection now generally pay a fixed annual step-up of 1% to 5%, which behaves nothing like CPI indexing in a high-inflation decade. Confirm what a quote is indexed to before treating it as a substitute.
Raising a Funded Ratio Without Buying a Floor
If the ratio says flooring would hurt, the useful moves all change the ratio itself:
- Reduce essential spending. This shrinks the denominator directly and permanently, and it is the only lever that works at any funded ratio.
- Work longer. It adds to the numerator, shortens the horizon, and shrinks the denominator at the same time.
- Delay Social Security. It reduces the ladderable gap before it changes anything else.
- Relocate. State income tax and cost of living move the denominator, sometimes substantially. See how state taxes affect retirement.
The Case Against Flooring at All
The strongest arguments on the other side:
- The equity premium is real and you are giving it up. Locking 30 years of spending at a known real rate forfeits the expected return that historically made portfolios grow. For a household that can absorb variance, that is an expensive certainty.
- Flexible withdrawal is a competing technology. Cutting spending in bad years achieves much of what flooring achieves, without the capital commitment. See safe withdrawal rates.
- A ladder self-liquidates. If leaving money behind matters, a floor that ends at zero works against it.
- The tail past the last rung is uncovered. A 30-year ladder bought at 65 ends at 95, which is exactly where a long-lived retiree is most exposed and least able to adapt.
- CPI is not your personal inflation rate. A retiree with heavy healthcare exposure faces a basket that has historically outrun the index the ladder tracks.
When This Framing Breaks Down
- When discretionary spending is a large share of the total. The regimes assume the floored liability is close to the whole spending need. A household at 1.20x funded against essentials but drawing 7% of the portfolio for total spending is not in the indifferent regime, and a sweep will credit flooring for fixing a withdrawal-rate problem it did not cause.
- When the floor already exists. Ample pension plus Social Security means buying more floor converts equities to bonds without solving a problem.
- When retirement is more than a decade away. The liability is not knowable to the precision the ratio implies, and locking real yields for an undefined spending stream is a duration bet rather than a match.
- When the curve is unusual. The same floor cost 33.82x in August 2021 against 20.29x in August 2026. Thresholds derived at one curve do not transfer to another.
- When the ratio was computed against an assumed return. Then it is a forecast, and the regimes do not apply to it.
Compute your own funded ratio
Prices your essential spending as a TIPS ladder at the live Treasury real curve, nets Social Security off first, and sweeps floor levels through the retirement simulation.
Open the Income Floor plannerA Sizing Sequence
- Estimate real annual essential spending. Housing, food, utilities, insurance, healthcare, transportation.
- Subtract expected inflation-indexed income: Social Security, any COLA-adjusted pension.
- Price a full floor on the remainder at today’s real curve rather than at an assumed return.
- Divide your portfolio by that cost to get the funded ratio.
- Read the regime. Below roughly 0.65x, work on the ratio instead of buying a partial floor. Through the middle band, flooring helps and the question is how much certainty you want. Above roughly 1.2x, buy it if you value the quiet.
- Recompute when real yields move materially or when your spending or guaranteed income changes.
Key Takeaways
- Price the liability before deciding how much to cover. The funded ratio only means something when its denominator is a market price rather than an assumed-return present value.
- The denominator moves with real yields. The same 30-year floor cost 20.29x annual income at the August 13, 2026 curve and 33.82x at the August 2021 curve.
- Flooring can lower your odds when you are far short. In one modeled 65-year-old scenario at 0.50x funded, a 25% floor cut simulated success from 29.6% to 9.2%.
- Through the middle band it helps. In the same scenario at 0.80x funded, a 25% floor raised simulated success from 86.5% to 94.4%.
- Delayed Social Security is usually the cheapest floor. It is CPI-indexed, longevity-pooled, and raises the benefit 8% per year of delay past full retirement age.
Frequently Asked Questions
How much of my retirement income should be guaranteed?
It depends on your funded ratio: your portfolio divided by what a full floor on your essential spending costs at today’s real yield curve. In one modeled 65-year-old scenario, flooring lowered simulated success below about 0.65x funded, raised it between about 0.65x and 1.2x, and made little difference above 1.2x. Compute the ratio before picking a percentage.
What is a funded ratio in retirement planning?
Portfolio value divided by the present cost of your liability. The version that carries information uses a market price for the denominator, such as what a TIPS ladder covering that spending would cost today. A ratio computed at an assumed return is a forecast wearing a funded ratio’s name.
Can buying a TIPS ladder make my retirement plan worse?
Yes, if you are far short of funding it. Guaranteeing an income you already know is insufficient spends capital to remove the possibility of the strong returns that were the only path to sufficiency. In one modeled scenario at 0.50x funded, a 25% floor cut simulated success from 29.6% to 9.2%. Well-funded households do not have this problem.
Does Social Security count as part of my income floor?
It is the largest part of the floor for most US households, and it is already CPI-indexed and longevity-pooled. Net it off your essential spending before pricing anything, or you will buy the same protection twice.
How much does it cost to guarantee $50,000 a year of spending?
At the Treasury real yield curve of August 13, 2026, a 30-year level TIPS ladder funding $50,000 a year in today’s dollars cost about $1.01 million, plus 1% to 2% for bid-ask spreads and odd lots. That figure moves with real yields: the same ladder would have cost about $1.69 million at the August 2021 curve.
Should I floor my whole retirement or just the essentials?
Essentials, in most cases. Flooring discretionary spending guarantees the spending you would have been willing to cut, which is the least valuable thing to make rigid, and it raises the cost of the floor without lowering the risk that matters.
Related Guides
- Is Locking In Today’s TIPS Yields Market Timing? argues why responding to the current price of a floor is a different decision from forecasting where real yields go next.
- How to Build a TIPS Ladder covers construction, cost, taxes, and the maturity gap.
- The Certainty-Equivalent Funded Ratio applies the same idea to an entire balance sheet.
- Asset-Liability Matching explains why the discount rate belongs to the liability.
- Safe Withdrawal Rates is the main alternative to flooring.
- When to Claim Social Security covers the cheapest floor most households can buy.
More in Retirement Planning
Browse all retirement planning guidesGet new guides by email
Evidence-based, no jargon. At most two emails a month. Unsubscribe any time.
Try it in Summitward
See the income floor planner in action with your own financial data. Free to start, no credit card required.